
Weekend Equity Framework
How I start my weekly equity review.

My trading analysis is top down roughly following this hierarchy. Many of you will recognize this from my weekend Twitter threads.
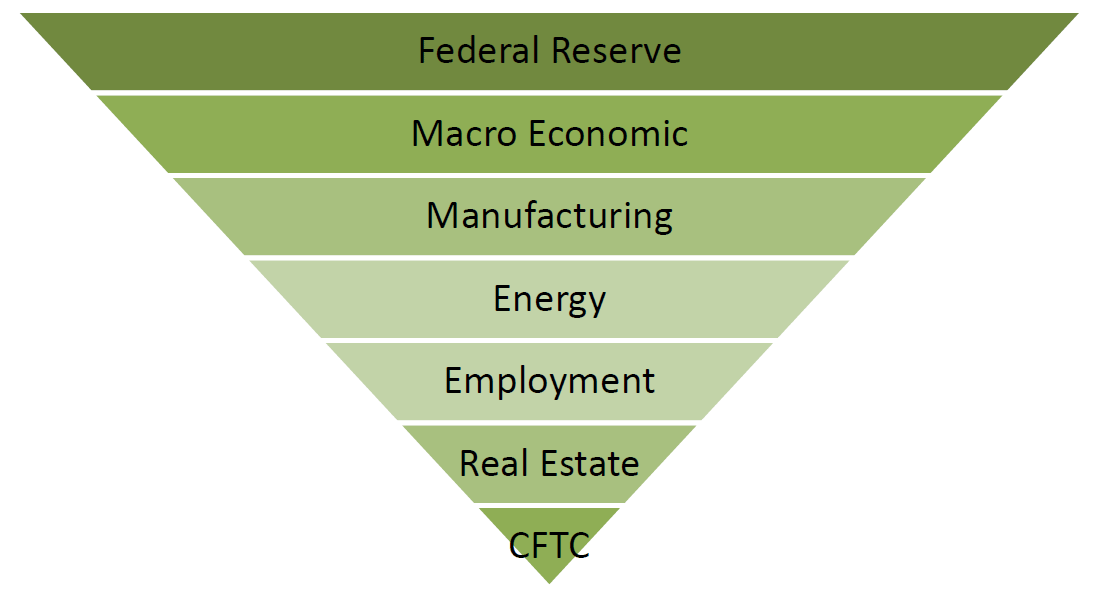
Once the macro-overview is complete, I get technical and granular in various markets beginning with equities. This note details the equity process.
Dorsey Wright Background
My introduction to technical analysis, market breadth, and internals in the 1990’s was via Tom Dorsey and his advisory firm with Watson Wright. I read everything Tom Dorsey and anyone at the firm wrote about technical analysis. Later I was introduced to the dean of Point and Figure Analysis - Jeremy DuPlessis and we are friends today, and Dorsey’s market analysis remains key in my workflow.
Tom Dorsey grounded all of his work in Point and Figure Analysis, the X’s and O’s. This isn’t a P&F dissertation. I unconditionally recommend all of Jeremy’s excellent books on the topic. The brief summary of 3-box reversal P&F:
Rising prices are plotted with columns of X’s
Declining prices are columns of O’s
The box size, an X or O, may be mathematical or logarithmic
A buy signal is a column of X’s exceeding a previous column of X’s and a sell signal a column of O’s breaking below a previous column of O’s.
Trend lines are drawn at 45-degree angles.
This is chart of front month WTI Crude Oil (CL) futures. The box size is logarithmic 0.5% and the software is Updata Analytics Enterprise https://www.updata.co.uk/ .
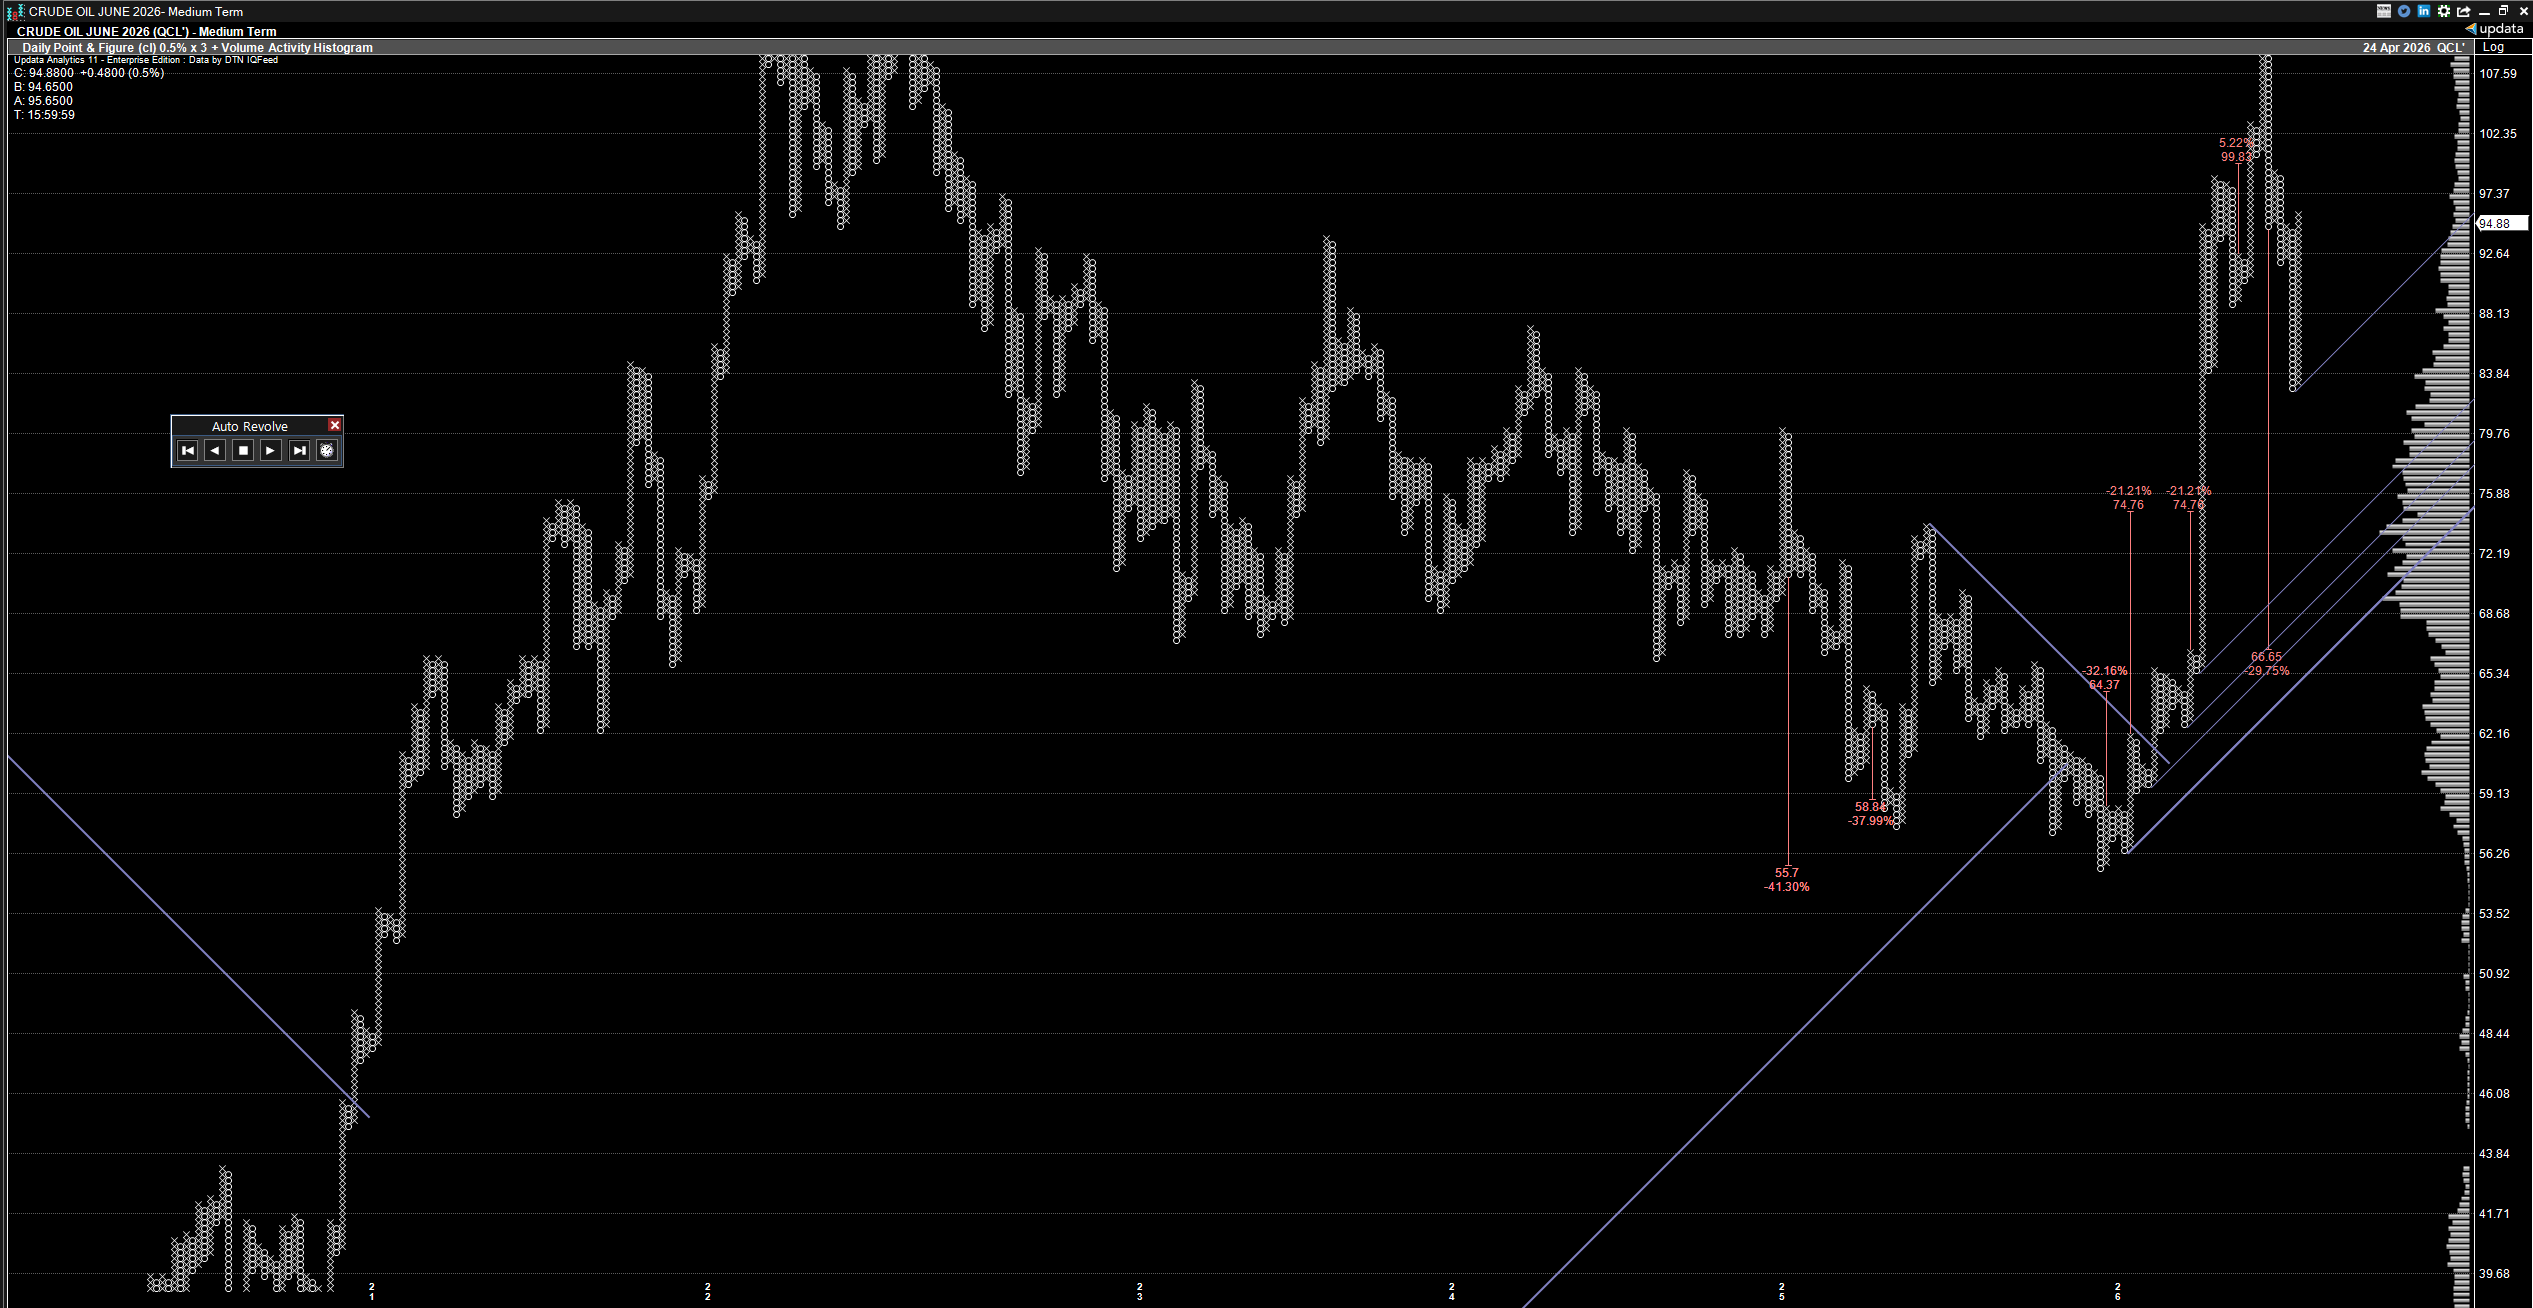
The most recent signal is a buy signal, and the commodity is positive trend.
Market Breadth Construction
Market internal and breadth analysis is conducted using these constructs though the background in the software is quite complex.
Select a portfolio representative of an index. This is easy for the S&P 500 and NDX 100, just use the stocks in the index. For the Russell 2000 I use the S&P 600 small cap index as the calculations for 2,000 names consumes a LOT of compute.
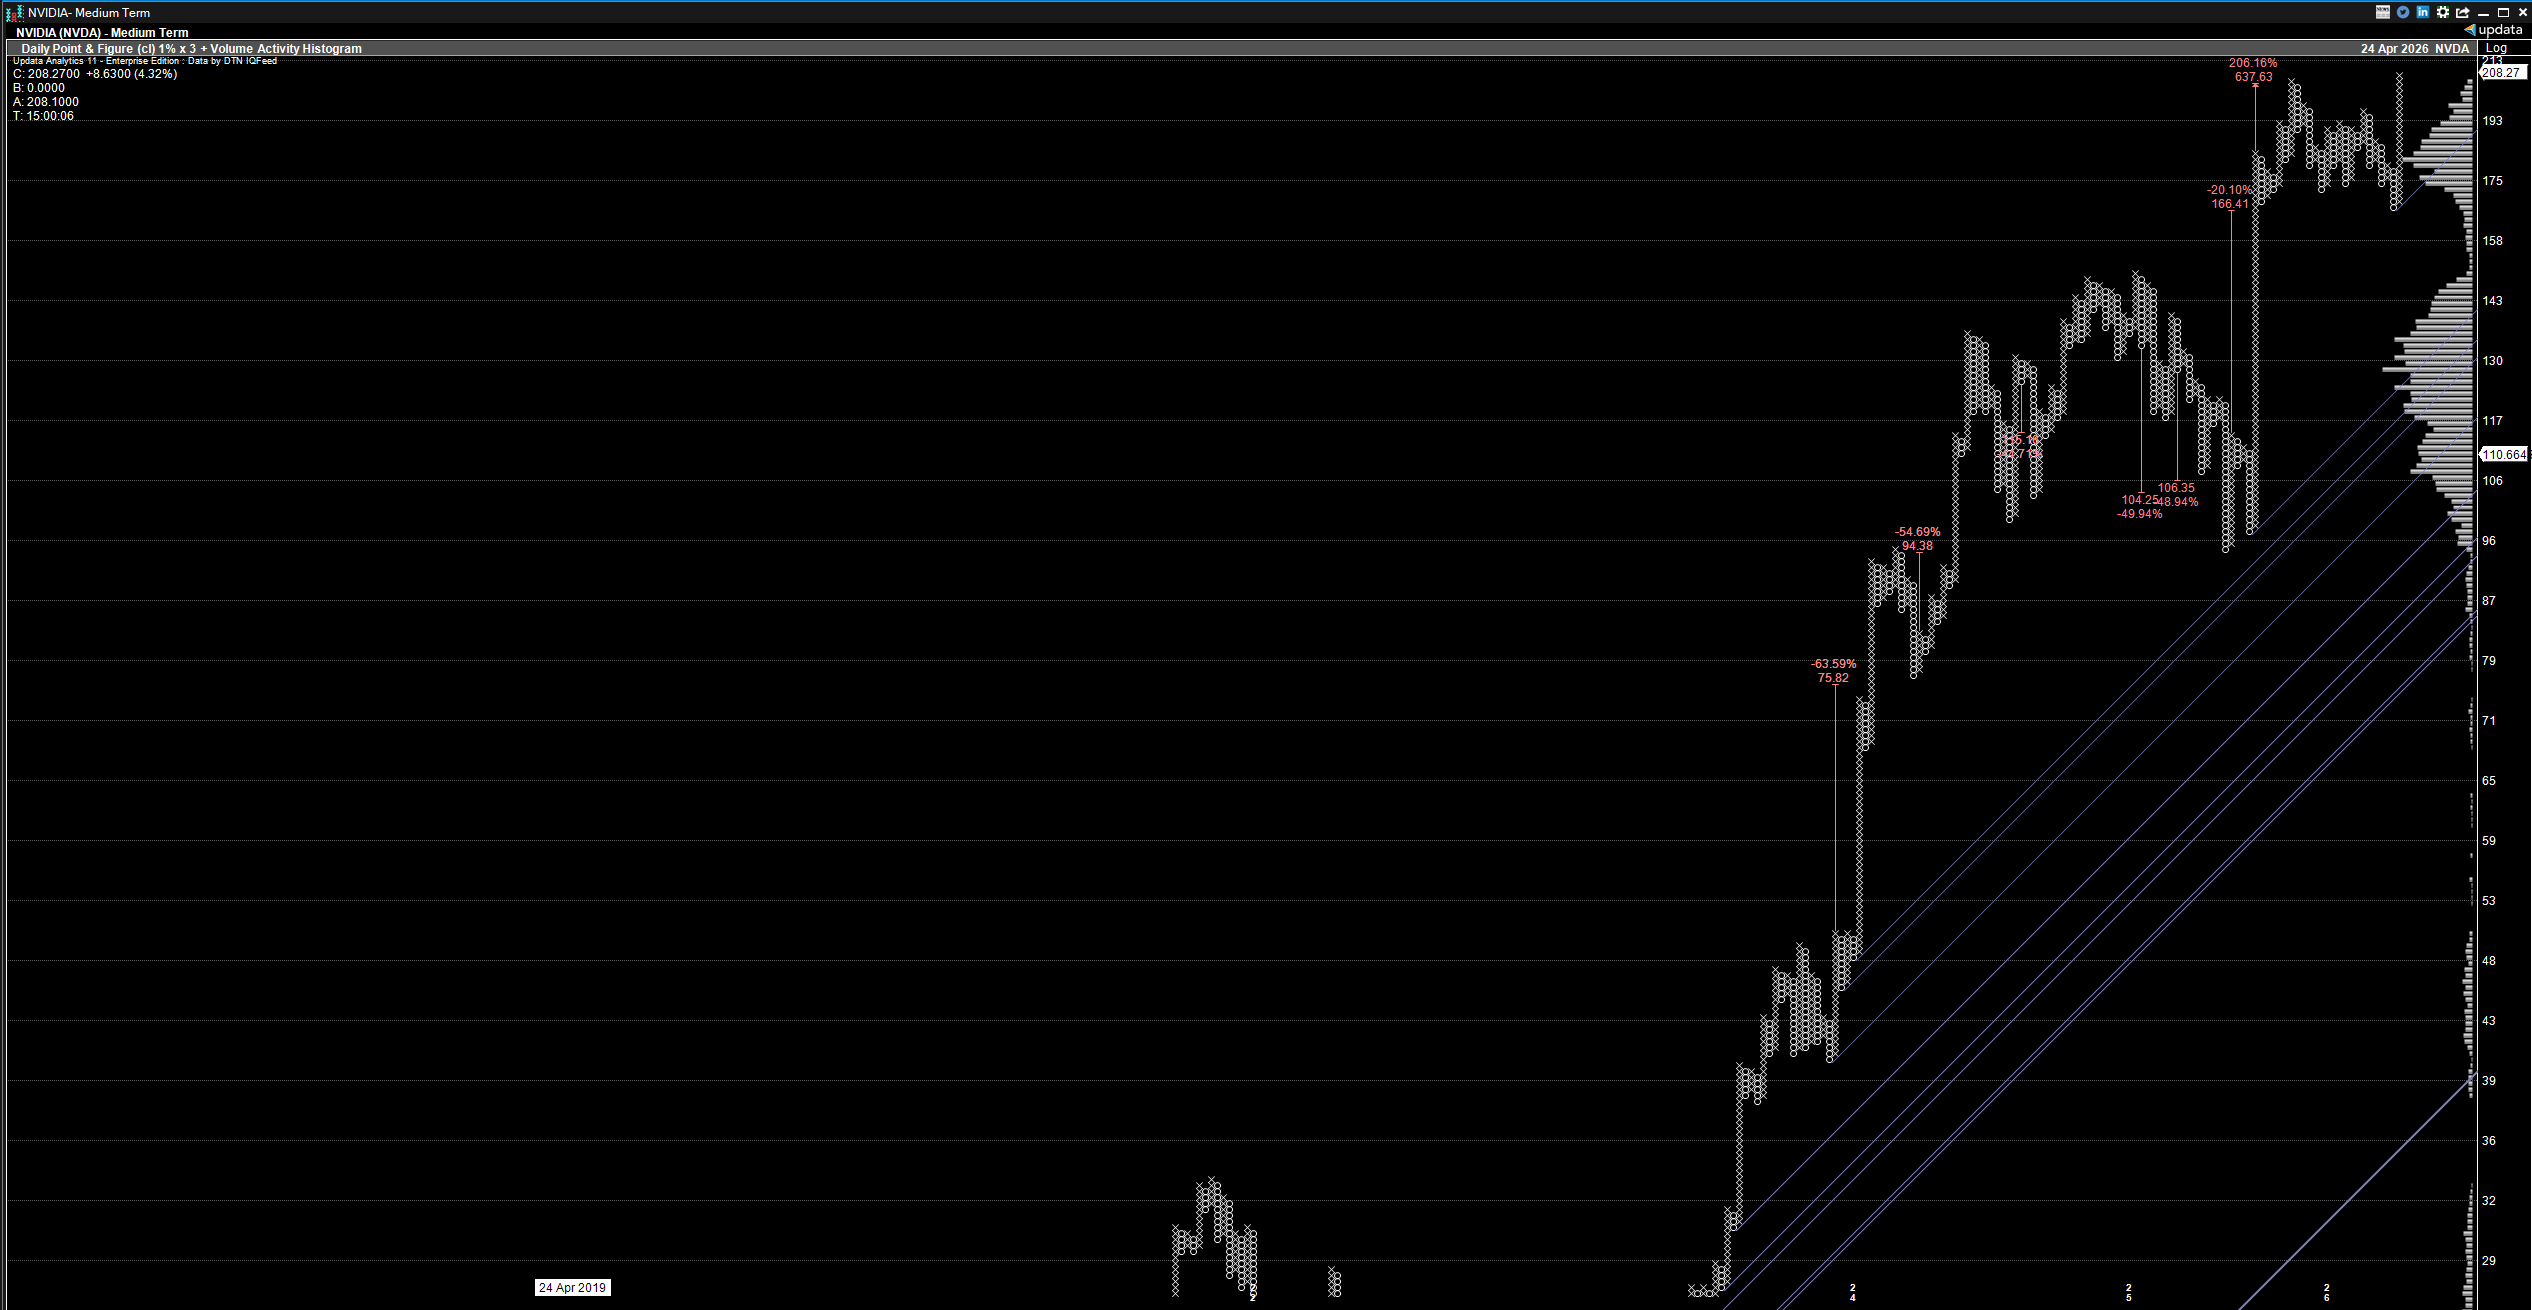
The software plots every stock in the background according to my parameters. A 3-box Point and Figure reversal is key, and I use 1% logarithmic box size.
This is NVDA trading on a buy signal and positive trend.
The software compiles the percentage of stocks trading positive trend and on buy signals. This forms the Index Bullish Trend and Bullish Percent. Bullish trend is the longest-term signal, not very useful weekly. Bullish Percent is useful.
The software compiles the percent of stocks trading above their 30 week and 10 week moving averages. Why 30 and 10? That is what Tom Dorsey used and I grew up on. Your mileage may vary. These are short-term often actionable signals.
The analysis can be run daily though it is very time and compute intensive, generally taking 1-2 hours to complete. I run it every Friday when I get home so the data is ready for Saturday morning.
Analysis Parameters and Notes
I review the 4 analyses from longest to shortest term.
Bullish Trend, moves slow, rarely changes an actionable amount, somewhat useful at extremes.
Bullish Percent. Intermediate term, useful indicator.
30- and 10-Week MA’s, faster, tactical.
The key levels for the indicators are 70% and 30% indicating the number of stocks that meet the criteria relative to the total number in the index universe. E.g. if 65 stocks in the NDX 100 are on a P&F buy signal then the Bullish Percent is 65%.
When reviewing the indicators it is important to note equity indexes have a long-term positive bias with occasional, sometimes sharp/violent, drawdowns. Sustained bear markets are rare and much less so in the post GFC easy money era.
These indicators do not give precise tactical entry and exits. They are risk measures that must be viewed in the big picture macro.
70% Plus - Not as Bearish as We Think
70% was a level Tom Dorsey identified as most, if not all are ‘in’. The risk if any of the indicators and definitely all of them simultaneously above 70% is all who want to buy stocks have done so and there are few buyers to push indexes higher.
Prior to the GFC this was a reasonable take, post GFC, less so. It is correct that the majority of market participants that want to be long are and the reward:risk on new or additional positions isn’t as lucrative as earlier in the trend. However, it isn’t the bearish signal it was historically.
Pre GFC >70% was a good indicator to begin trimming positions, investigate index hedges, and even consider short opportunities. Post GFC in the Bernanke Wealth Effect Fed regime and definitely post COVID indications >70% are assessed a little differently.
Persistent bull markets can push all four indicators at or above 70 and stay there while indexes continue to climb. It is challenging to initiate new positions in this regime, but selling may miss more gains and outright shorts can get our faces torn off post COVID.
When all four indicators are above 70, I am not initiating new longs and possibly trimming things that have good profits. Raising cash is Ok. Shorting just because 4 indicators are in historical danger zones is not a good idea post COVID
What I look for >70% is divergence, especially in the short-term moving average indicators. If the short-term indicators are making lower highs and the indexes making higher highs that is caution that usually leads to the Bullish Percent reversing down. This is a time to sell down some positions, consider index hedges, and if you are very nimble and short-term look at outright short positions.
Below 30% - TACO, Time to Get Long
Similar to the 70% Rubicon I assess indicators <30% differently post GFC and definitely post COVID.
Pre GFC this region was a time to stop selling, have a list of long positions for consideration. Post GFC and post COVID this has been a good signal to reject fear and start adding index length or individual positions.
Index trading in this era is generally characterized by long grinding uptrends with a few short, sharp, V-bottom corrections. Below 30% coincides reasonably well with the V-bottom.
Index Readings - April 25, 2027
This is a review of the indicators and my comments this weekend. Please note most of the time the indicators are middling and mostly confirming existing trends, very little signal. Extremes are what matters.
For visual reference I have horizontal lines on the breadth portion in the bottom pane of the charts.
70% Red
50% Blue
30% Green
Charts cover 3-4 years
S&P 500 Bullish Trend
This is the least tactical indicator and gives an indication of the persistent bull market in that it rarely goes below 50% and then quickly reverses. The sharp rise in the index without this indicator confirming is indicative of how narrow the leadership.
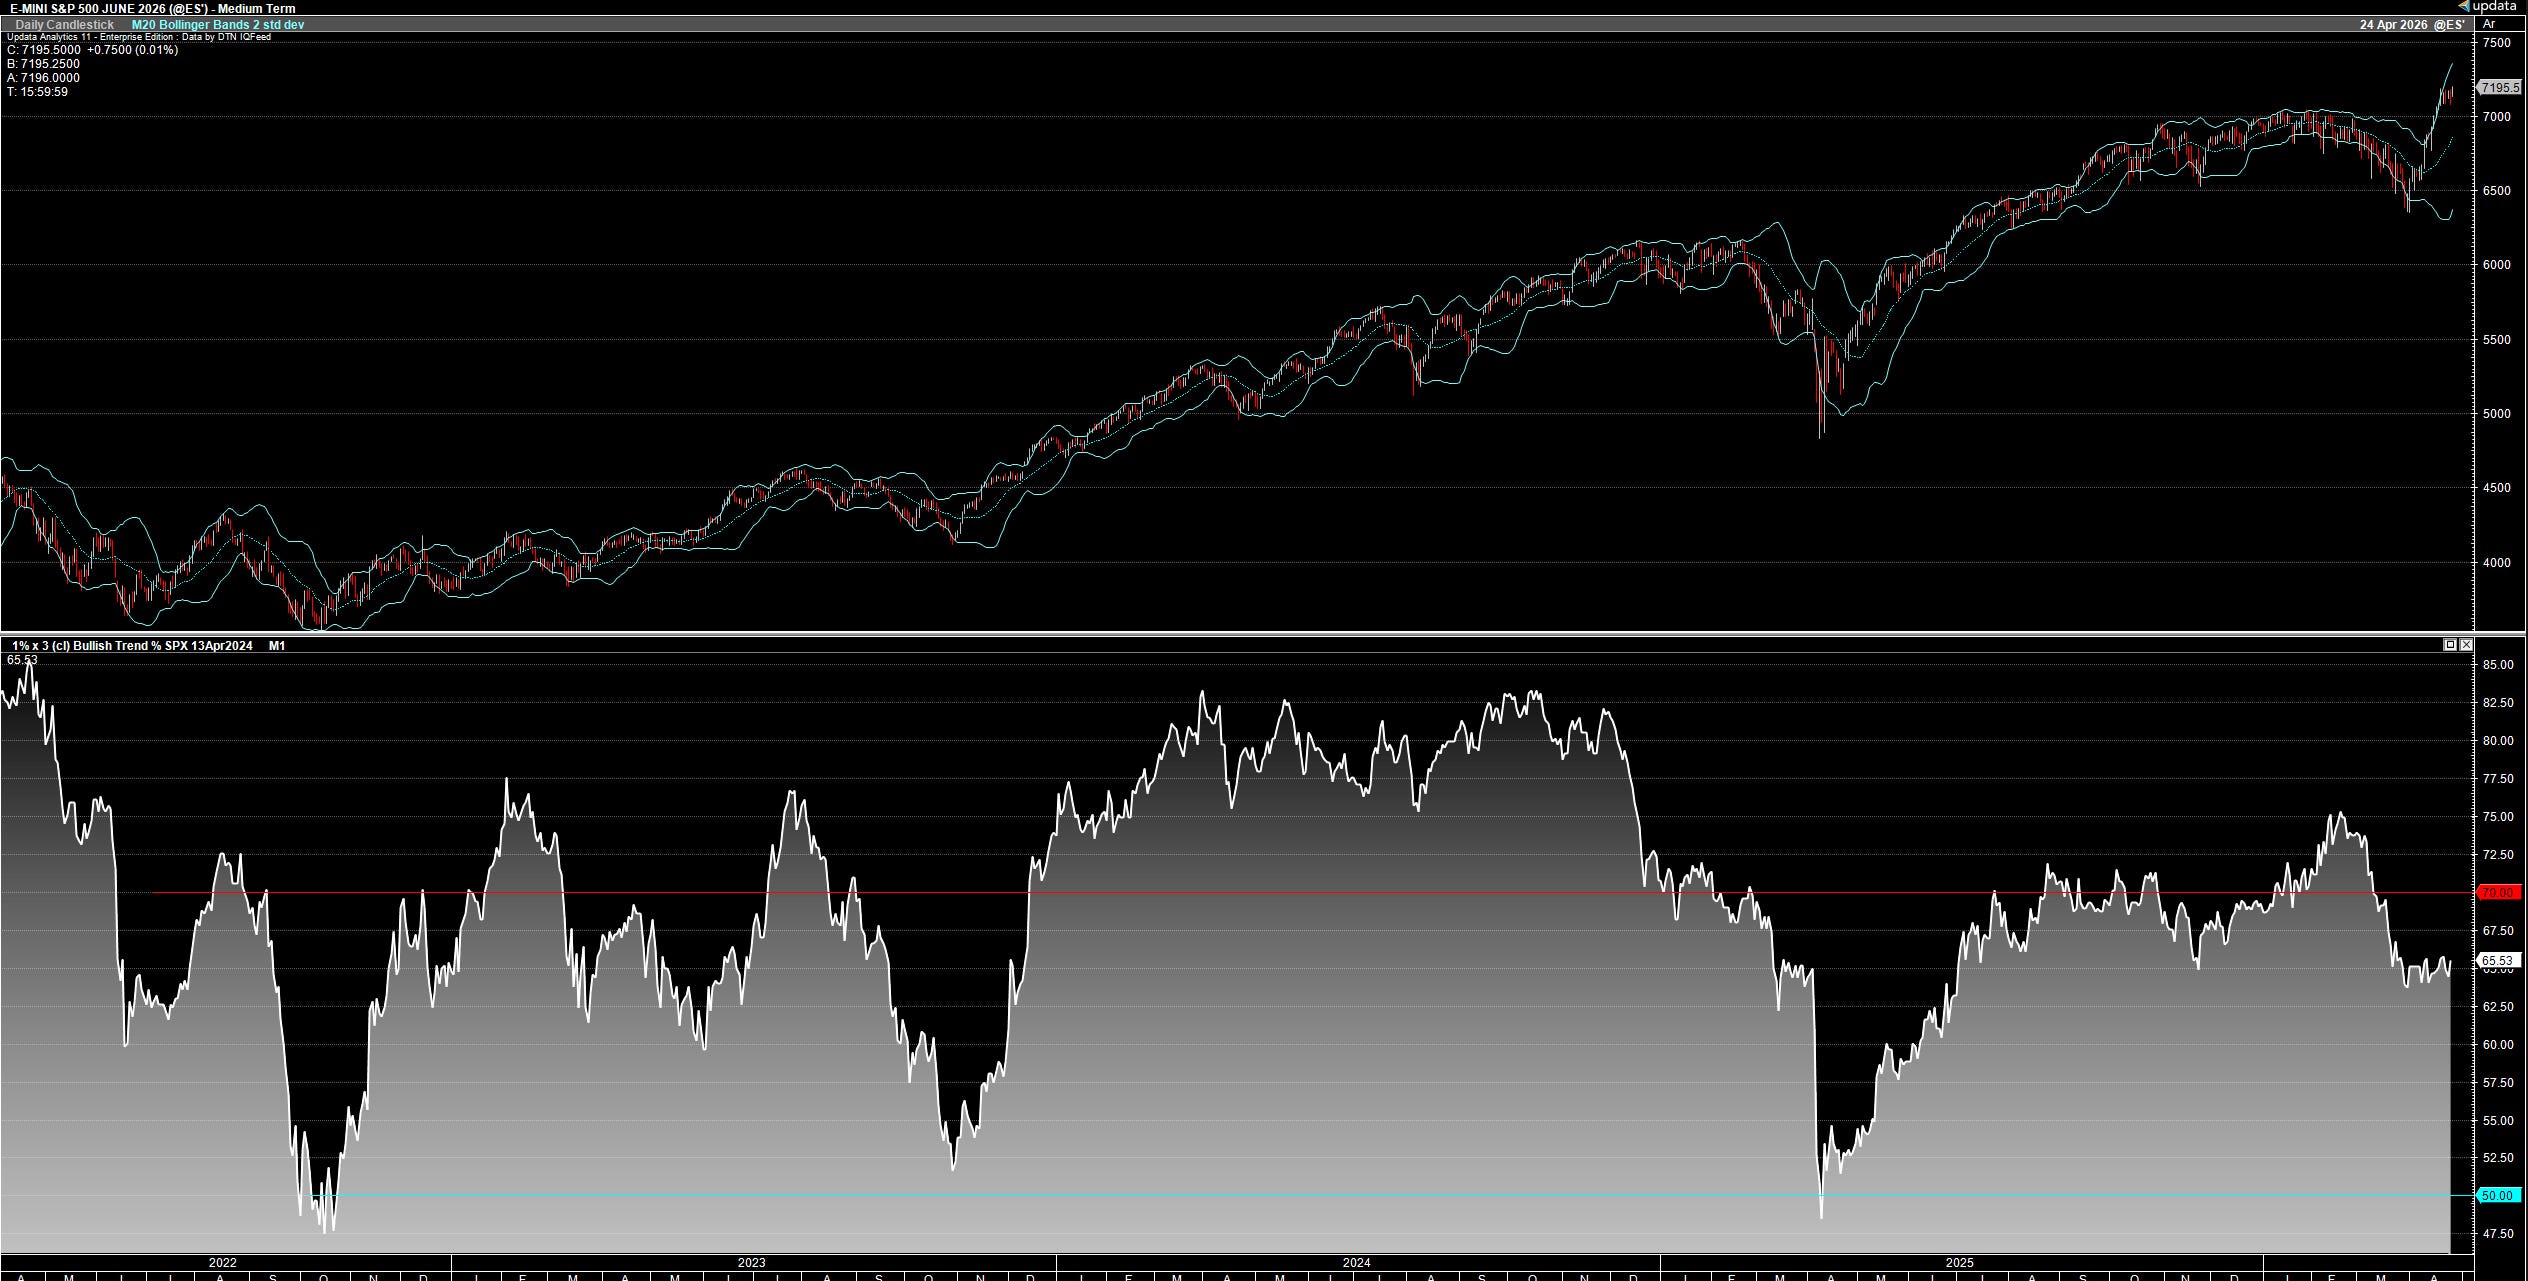
S&P 500 Bullish Percent
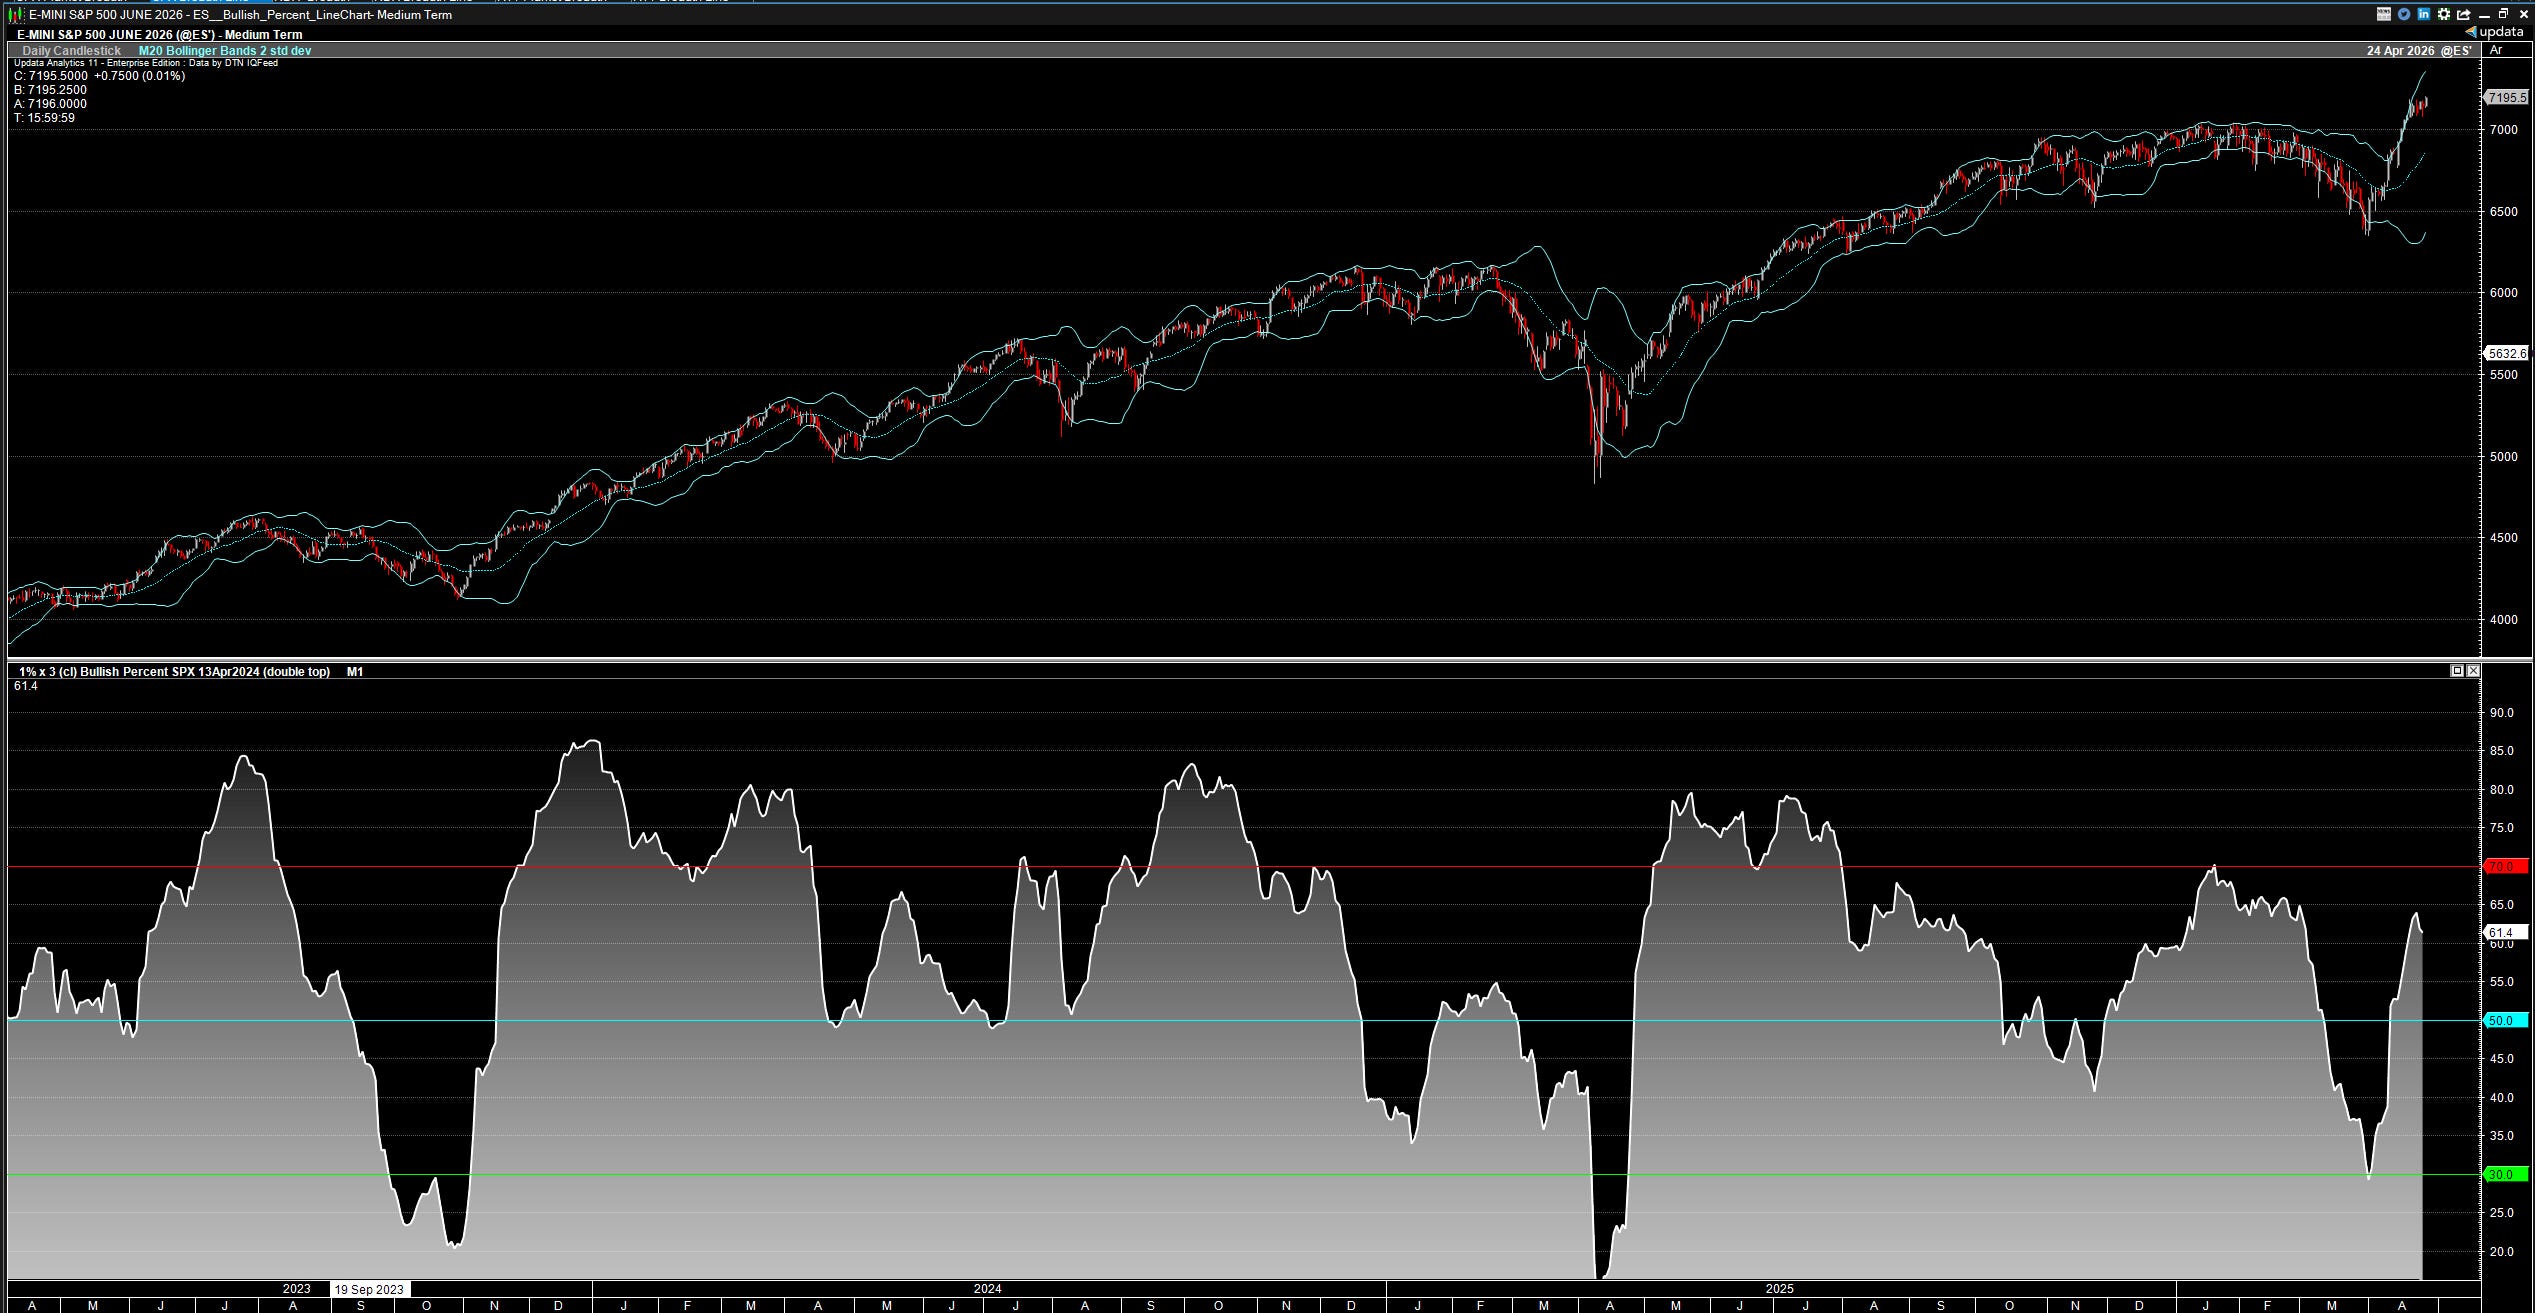
This intermediate term indicator has been good below 30%. Last year’s liberation day tariff TACO V-bottom is a good example. This year’s Iran Adventure bottom just ticked the 30 level, and I missed this trade expecting the indicator to go deeper and bottom to take a little (week(s)) longer.
S&P 500 Percent Above 150D (30W) Moving Average
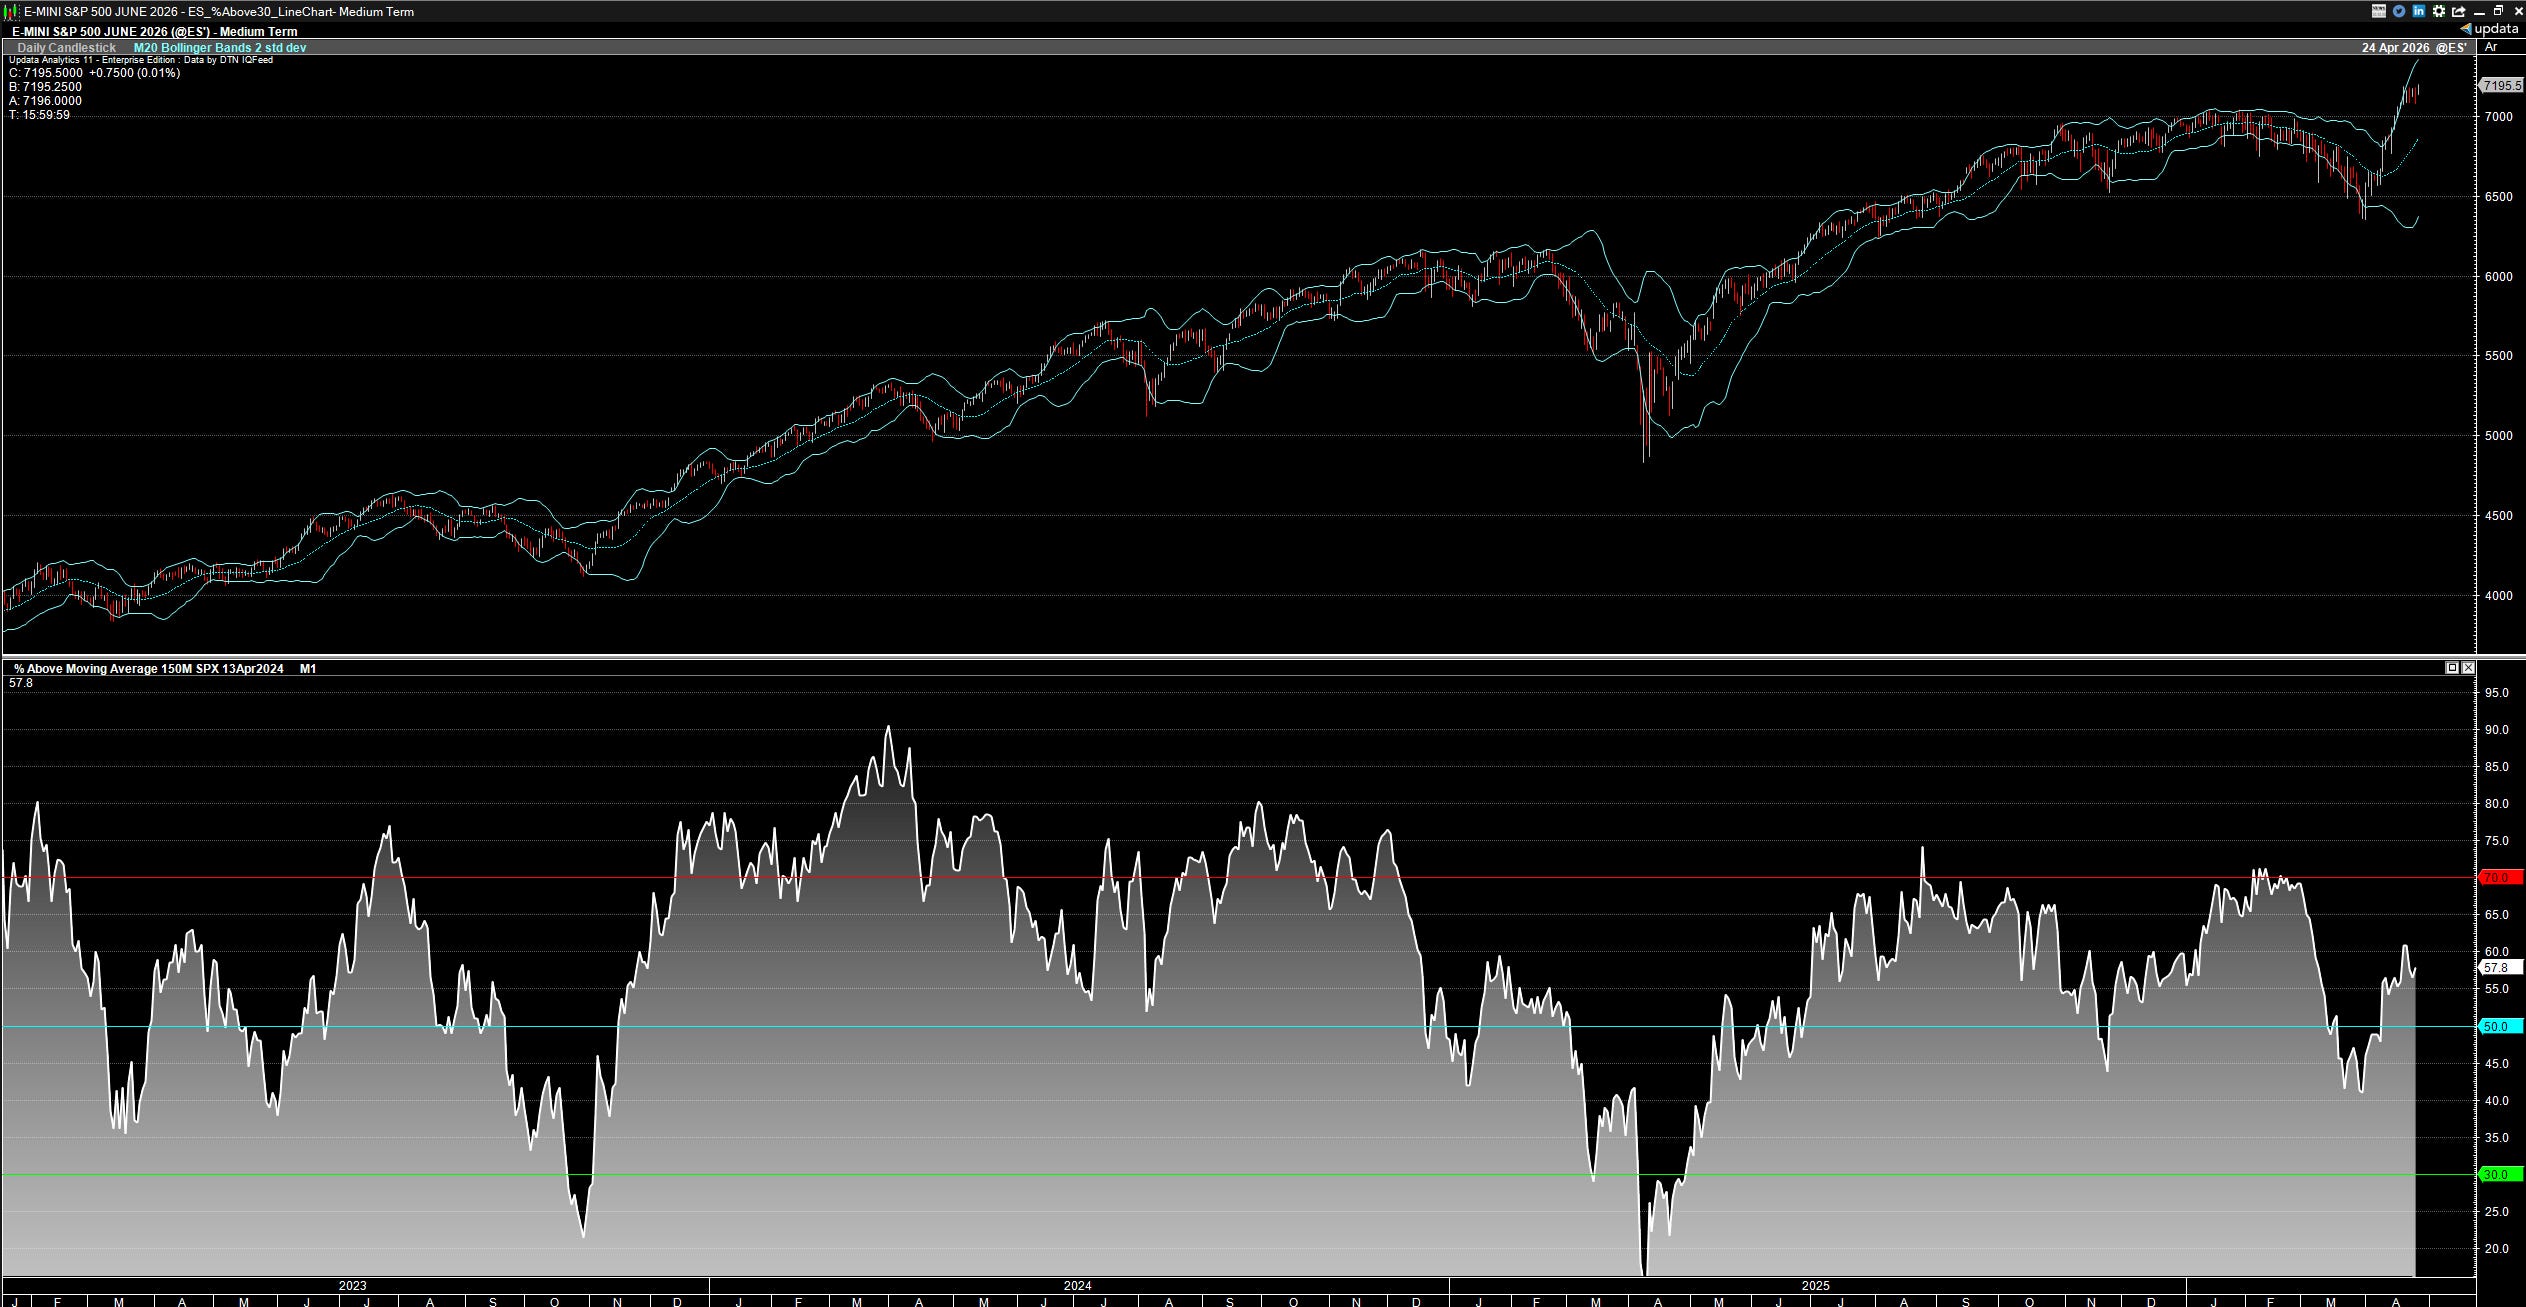
The 2023 bottom and the liberation day tariff TACO V-bottom were good trades, but similar to the Bullish Percent reading this one wasn’t obvious in the Iran Adventure TACO trade and it is interesting that the Iran adventure reversal has been arguably the most violent.
S&P 500 Percent Above 50D (10W) Moving Average
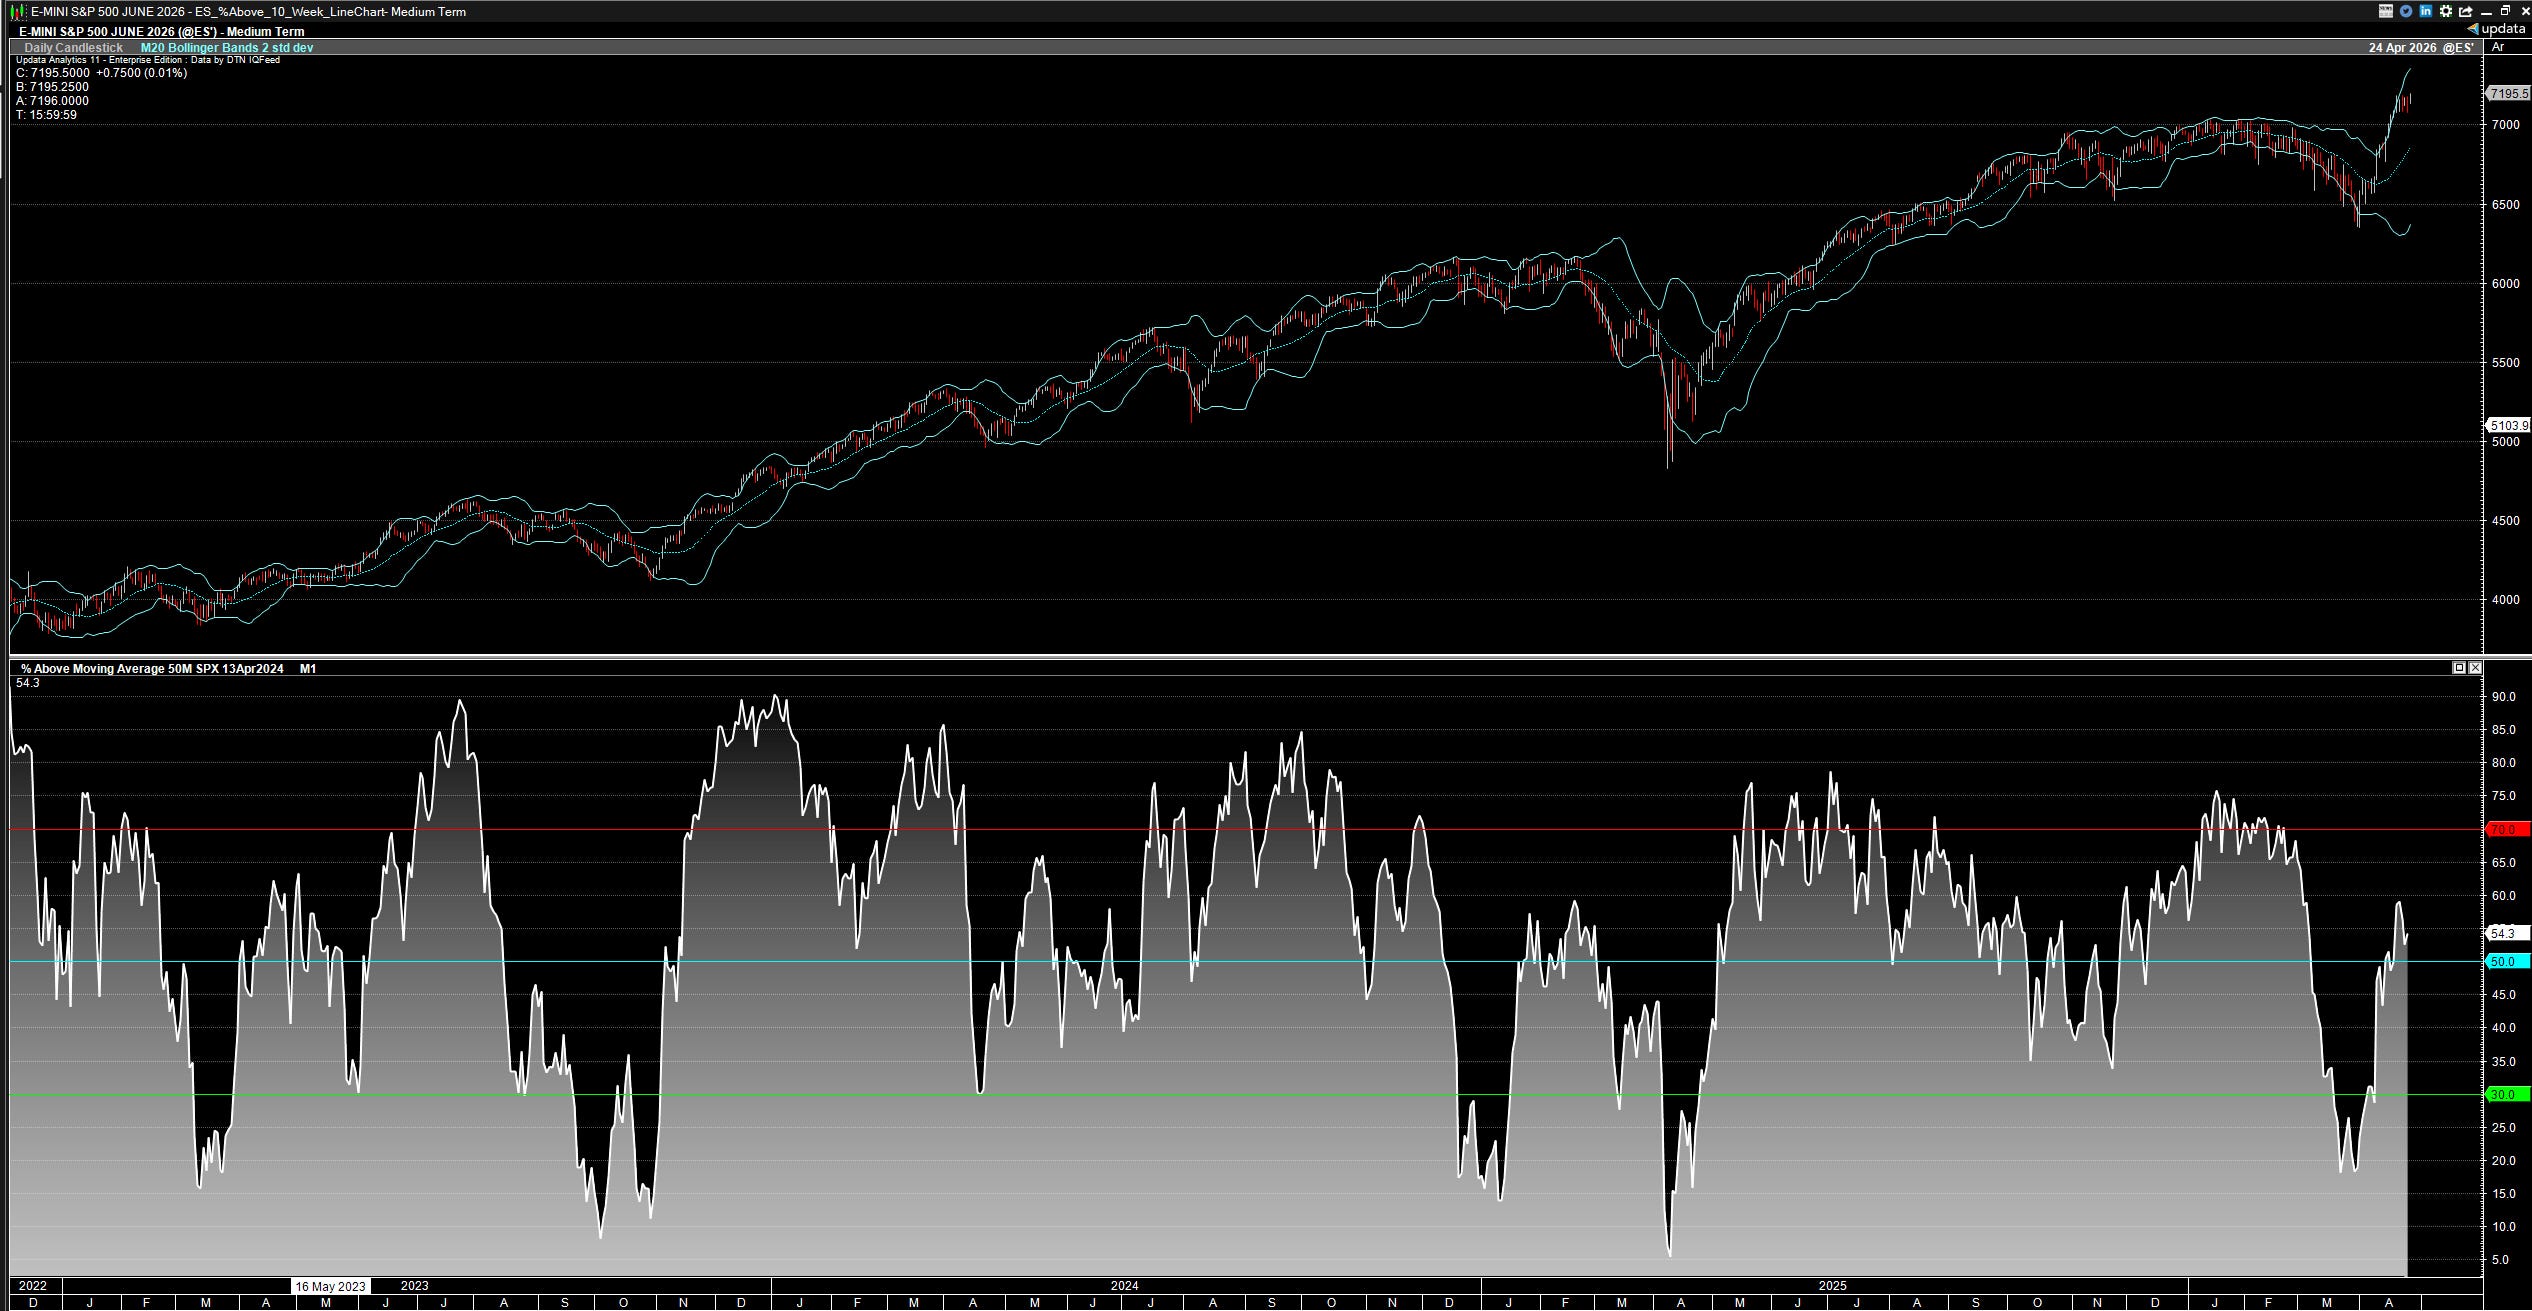
Short-term noisier indicator. This did give a signal for the Iran Adventure TACO reversal. I was expecting the 150D indicator to give a signal and the Bullish Percent to go deeper. I missed the bottom of this trade, it happens. Trending higher with the index, currently confirming.
NDX 100 Bullish Trend
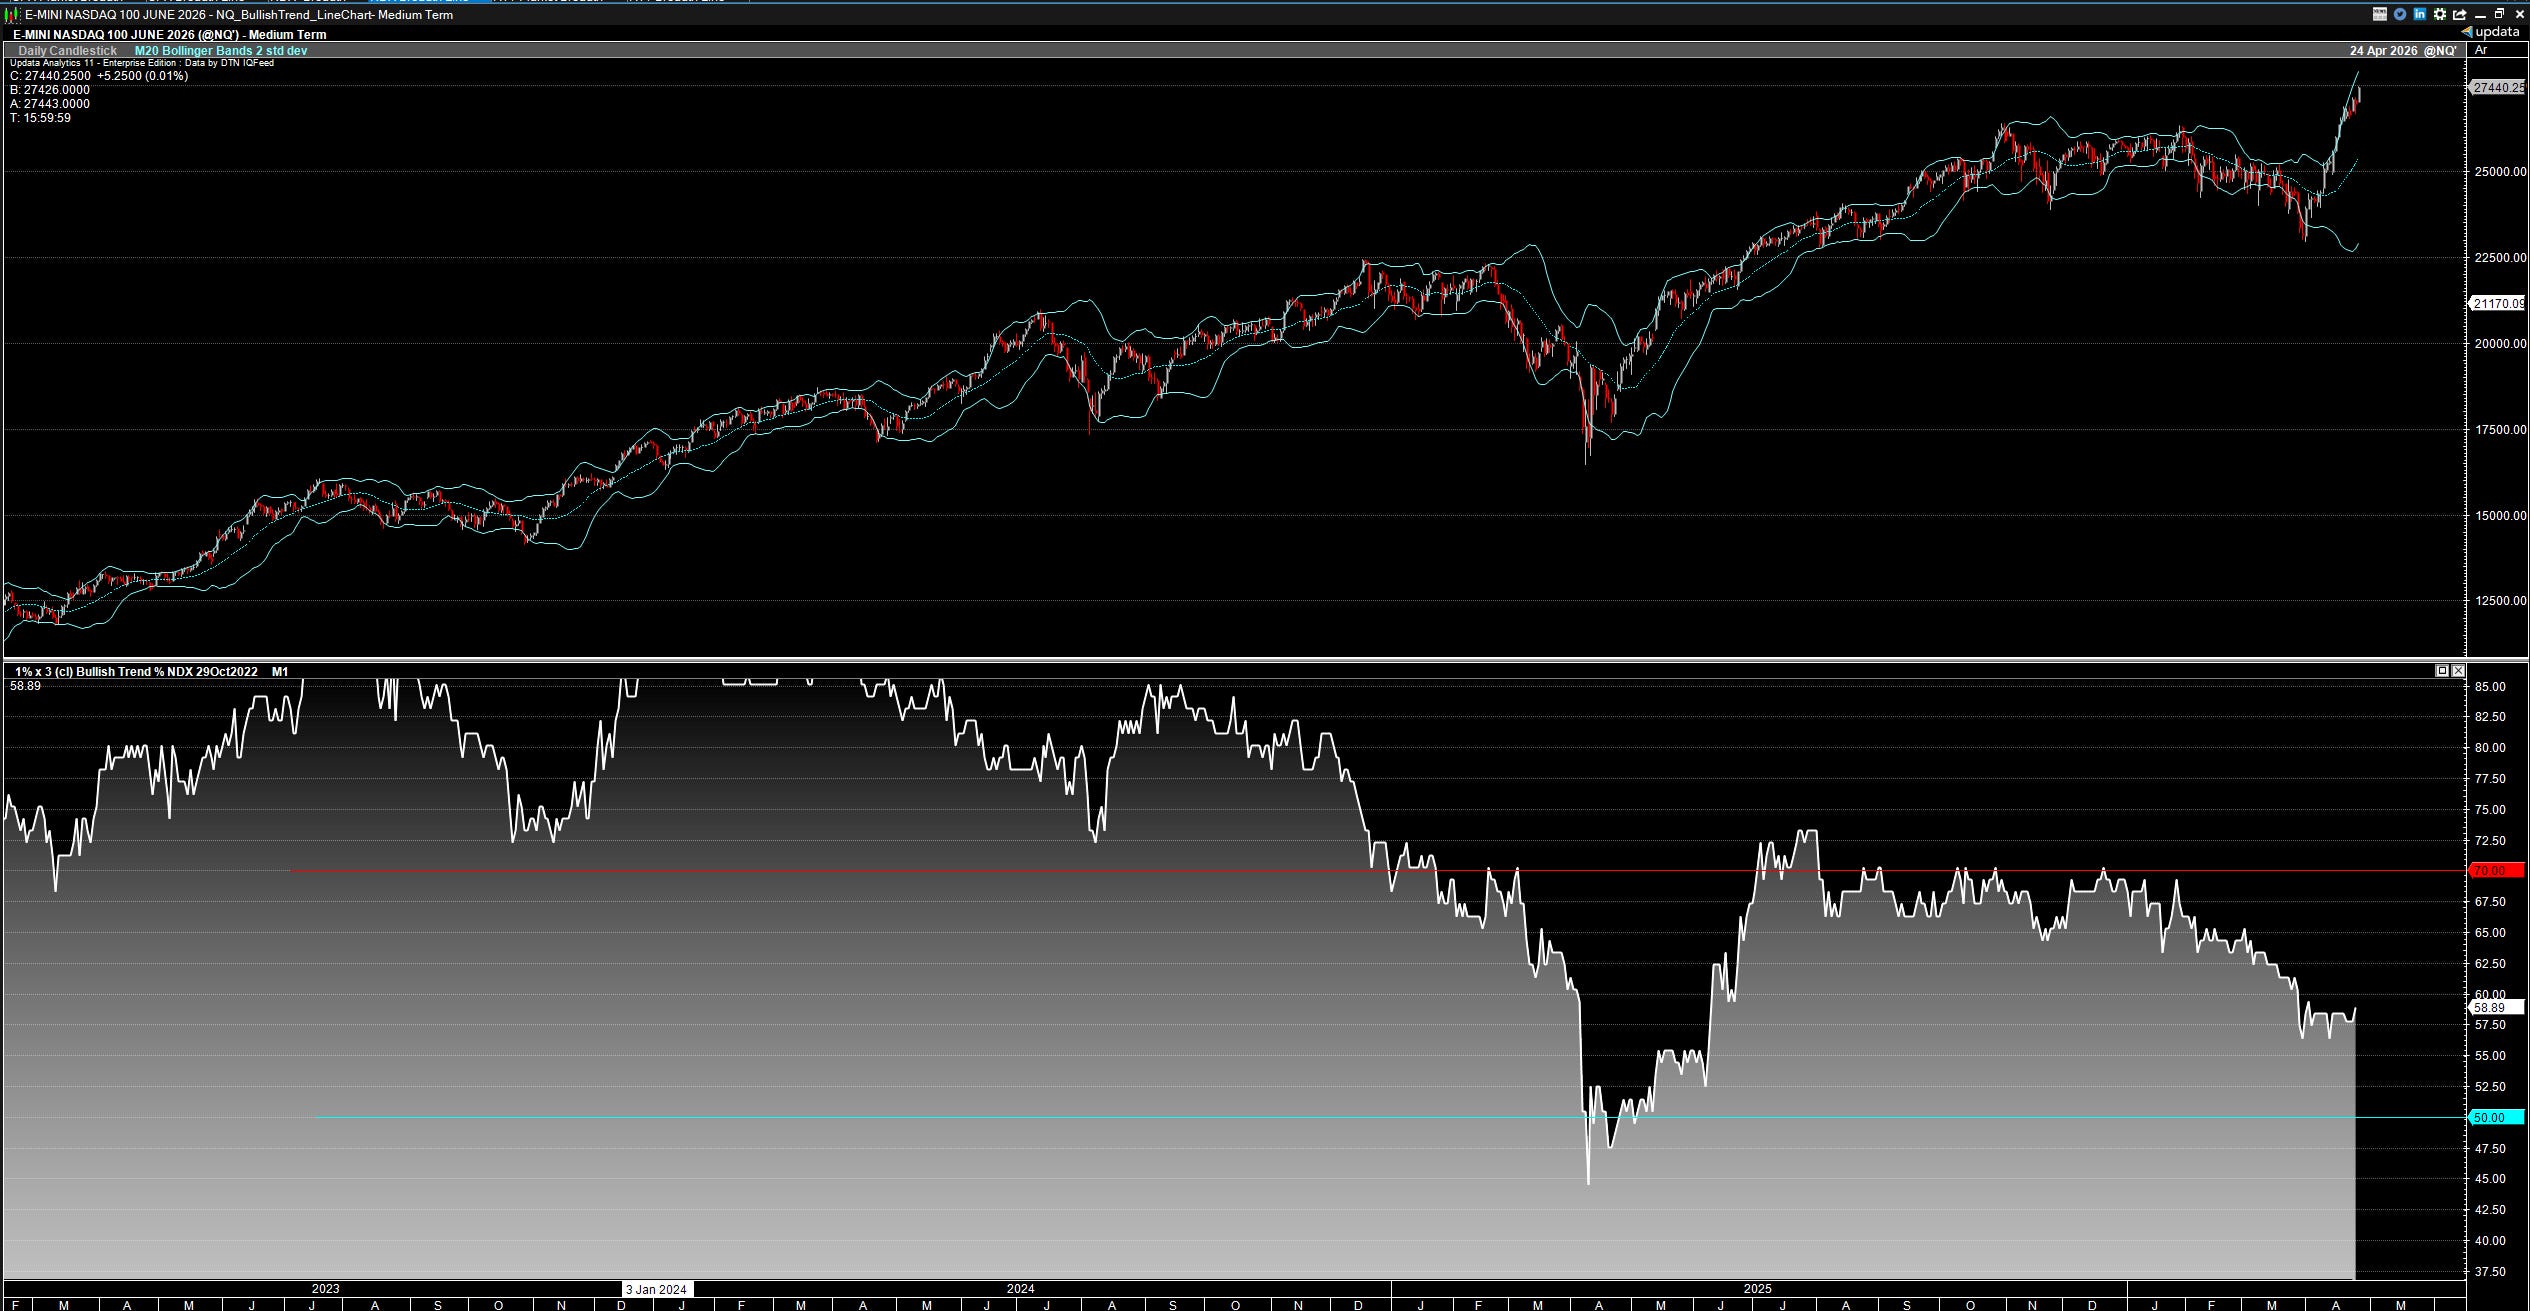
Similar to SPX this doesn’t give much signal in a persistent bull market. One thing of note here is the divergence going into liberation day last year. The lower highs while the index held up are notable. No meaningful signal for Iran reversal.
NDX 100 Bullish Percent
Good Iran signal, but I expected some more damage and didn’t act on it timely.
NDX 100 Percent Above 150D (30W) Moving Average
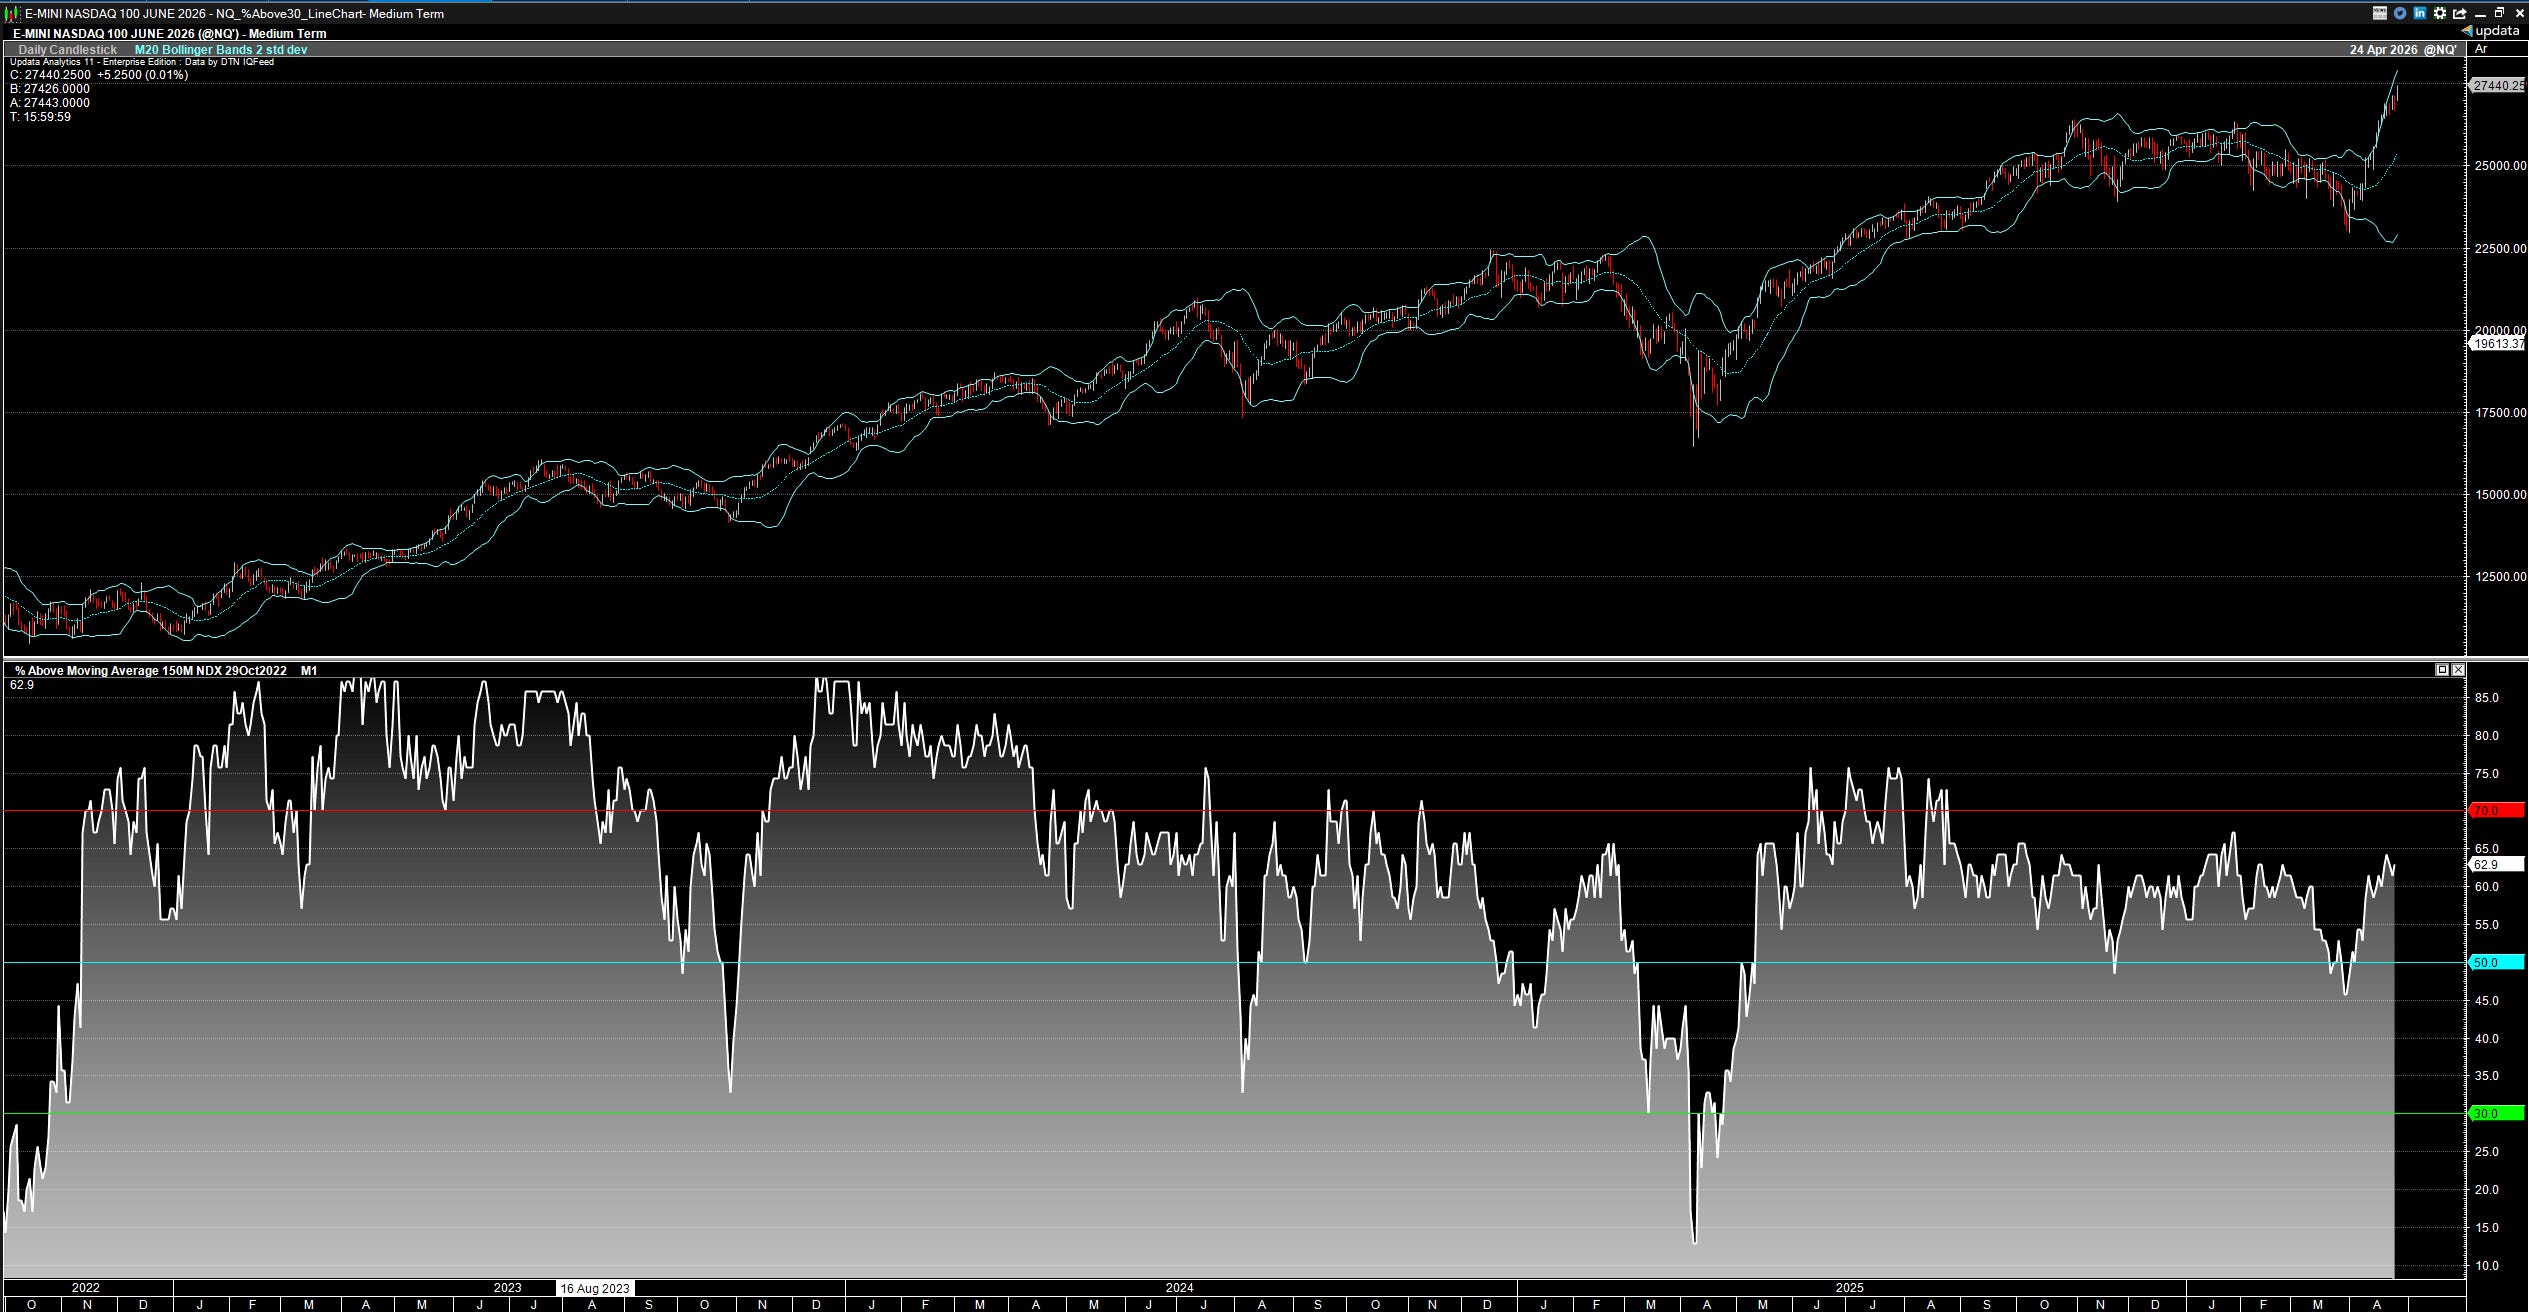
Same problem with the SPX. This didn’t give an Iran Adventure TACO signal and hence why I was waiting after the Bullish Percent signal. Additionally, this historically signals before Bullish Percent, not this time. Trending higher with the index.
NDX 100 Percent Above 50D (10W) Moving Average
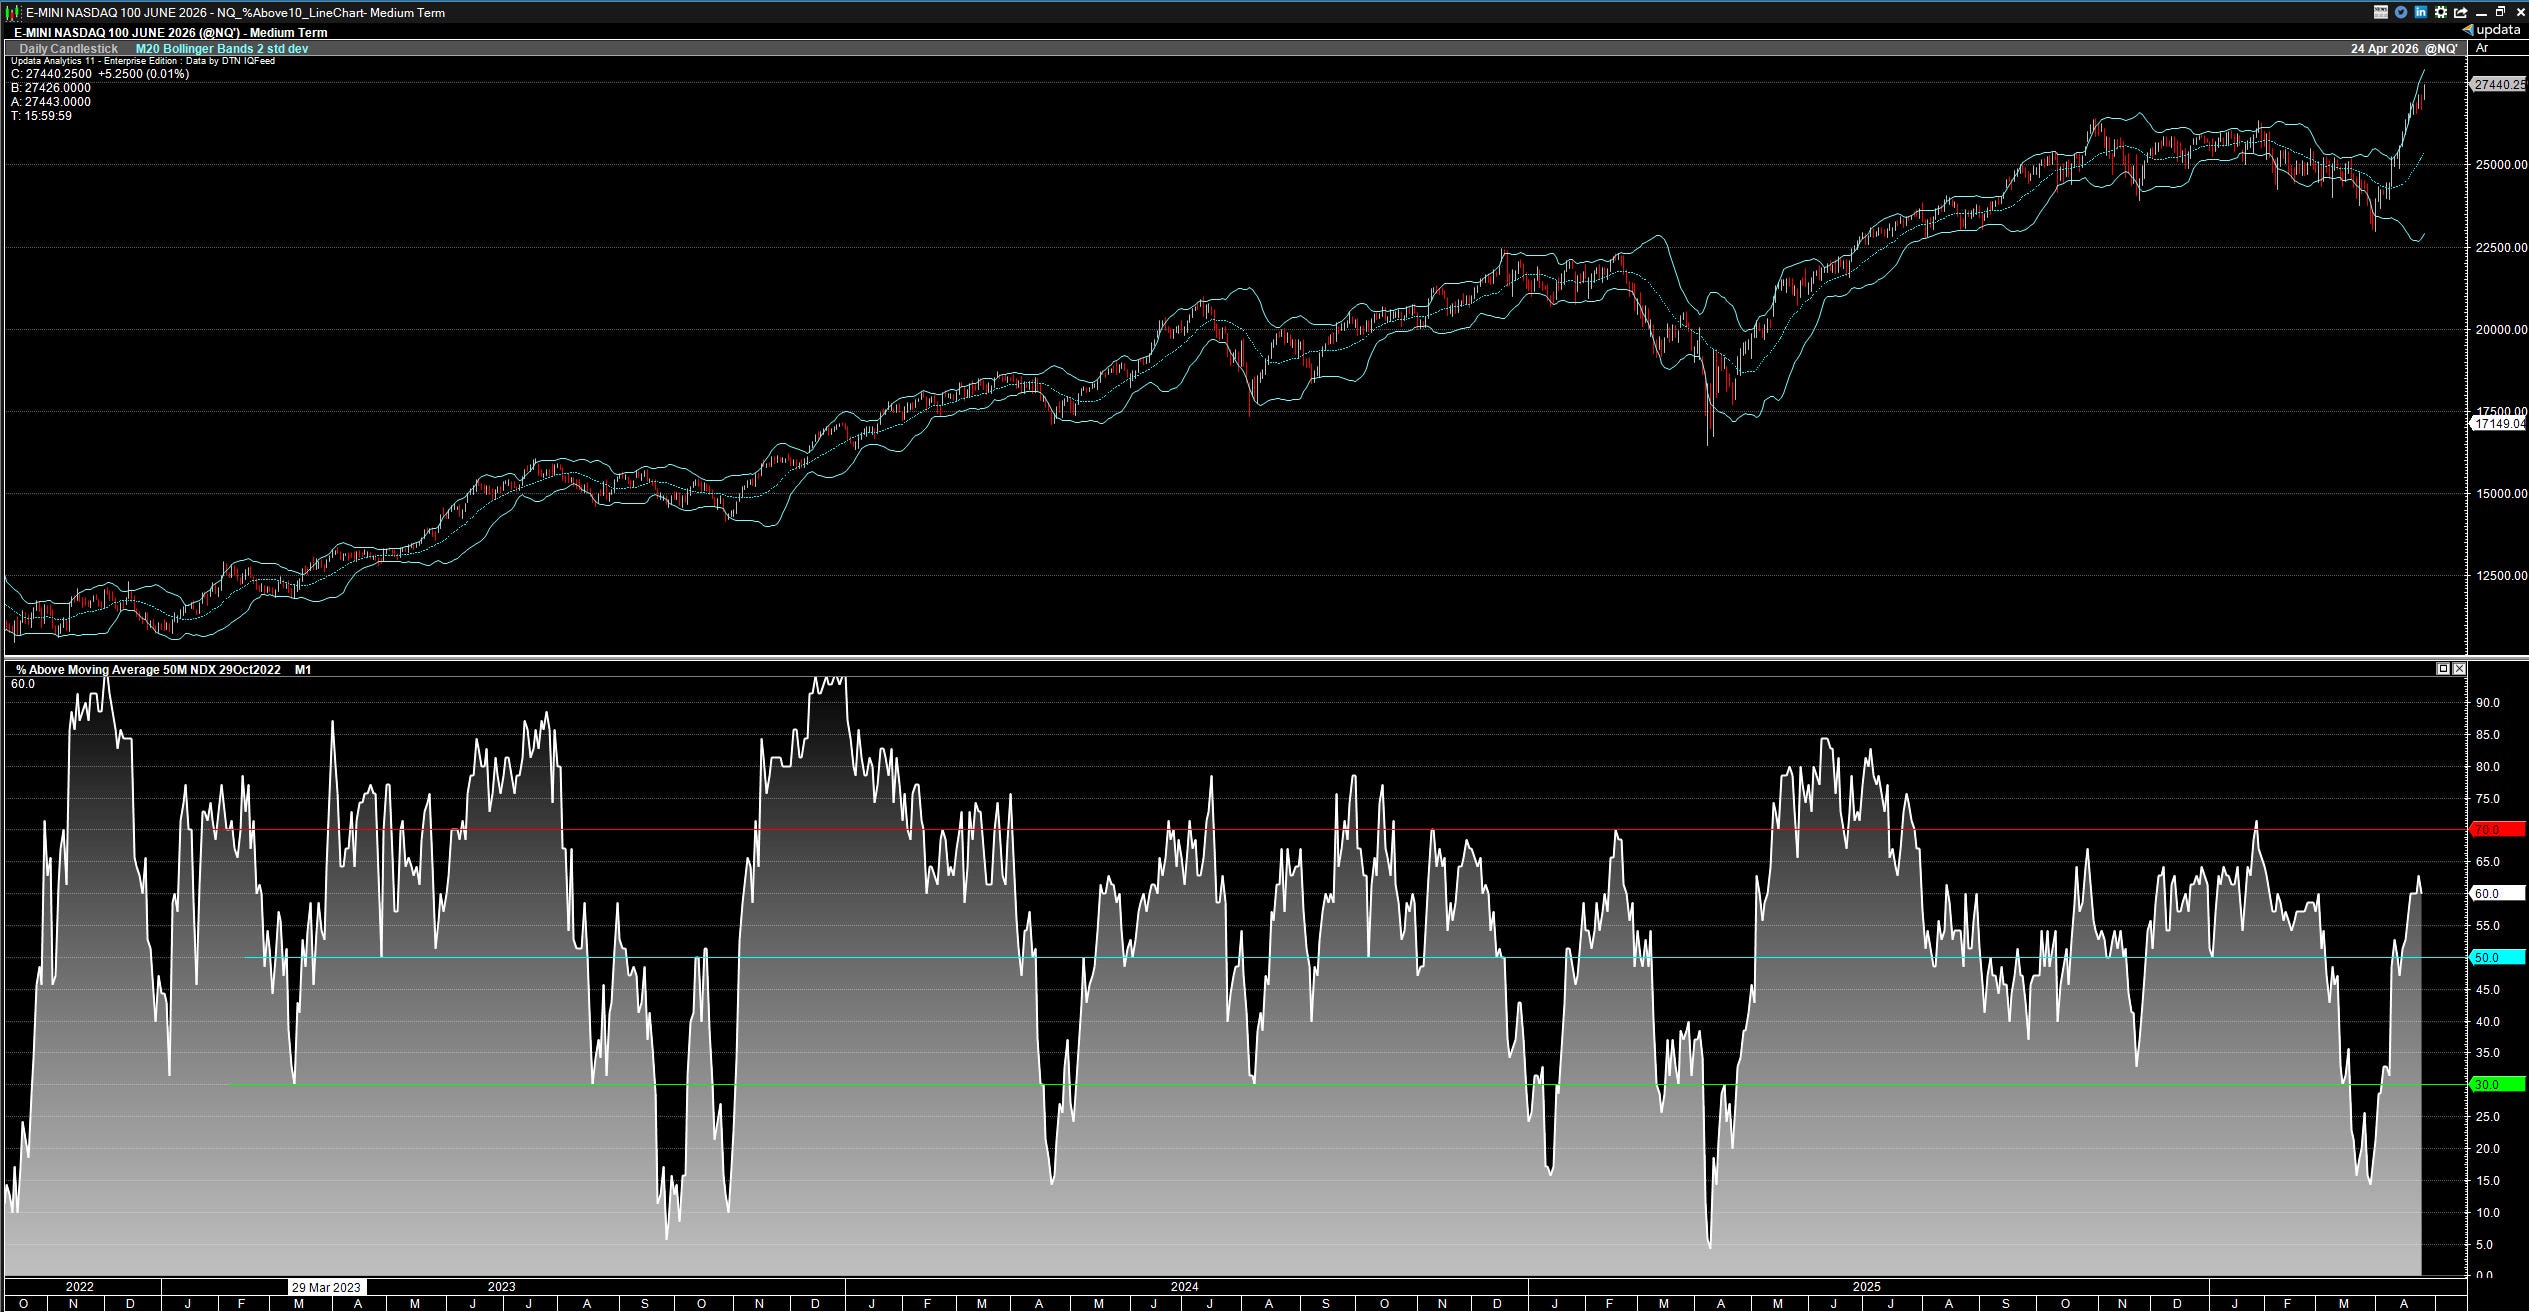
Good Iran Adventure signal. Currently climbing toward a bearish signal, but for now confirming the existing face ripping trend.
Russell 2000 Bullish Trend
Please note this references the SML 600 Universe of Stocks for Computational Efficiency
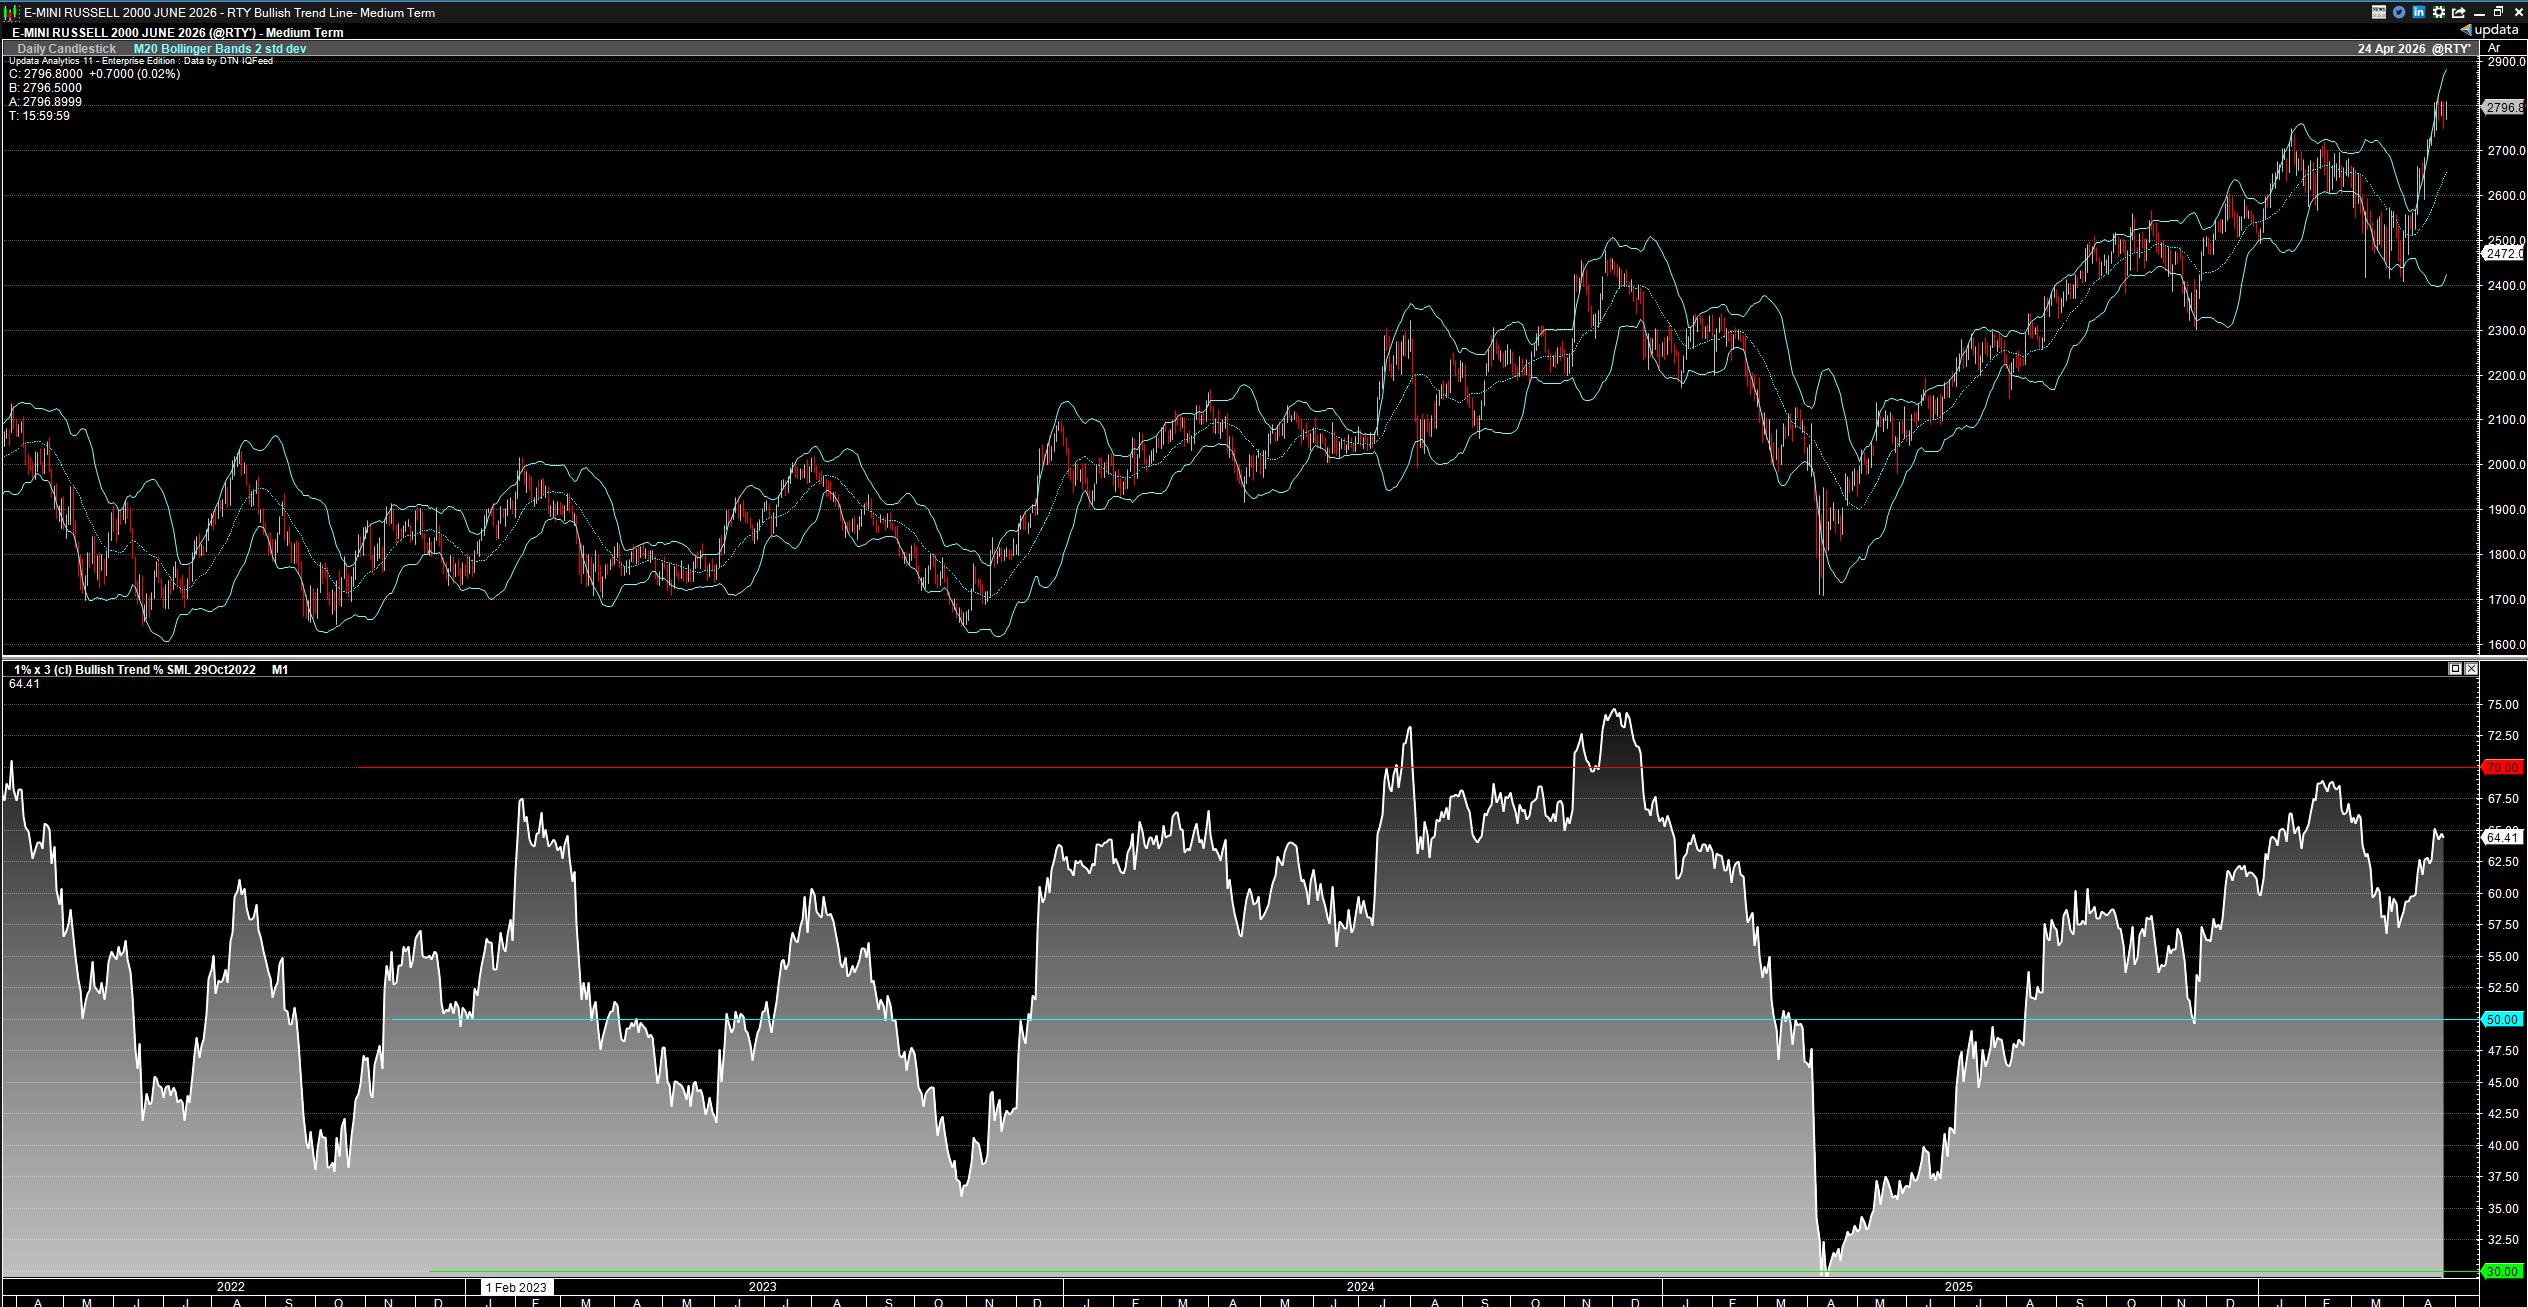
This one gave a rare <30 signal on the tariff TACO bottom, right now trending higher with the index.
Russell 2000 Bullish Percent
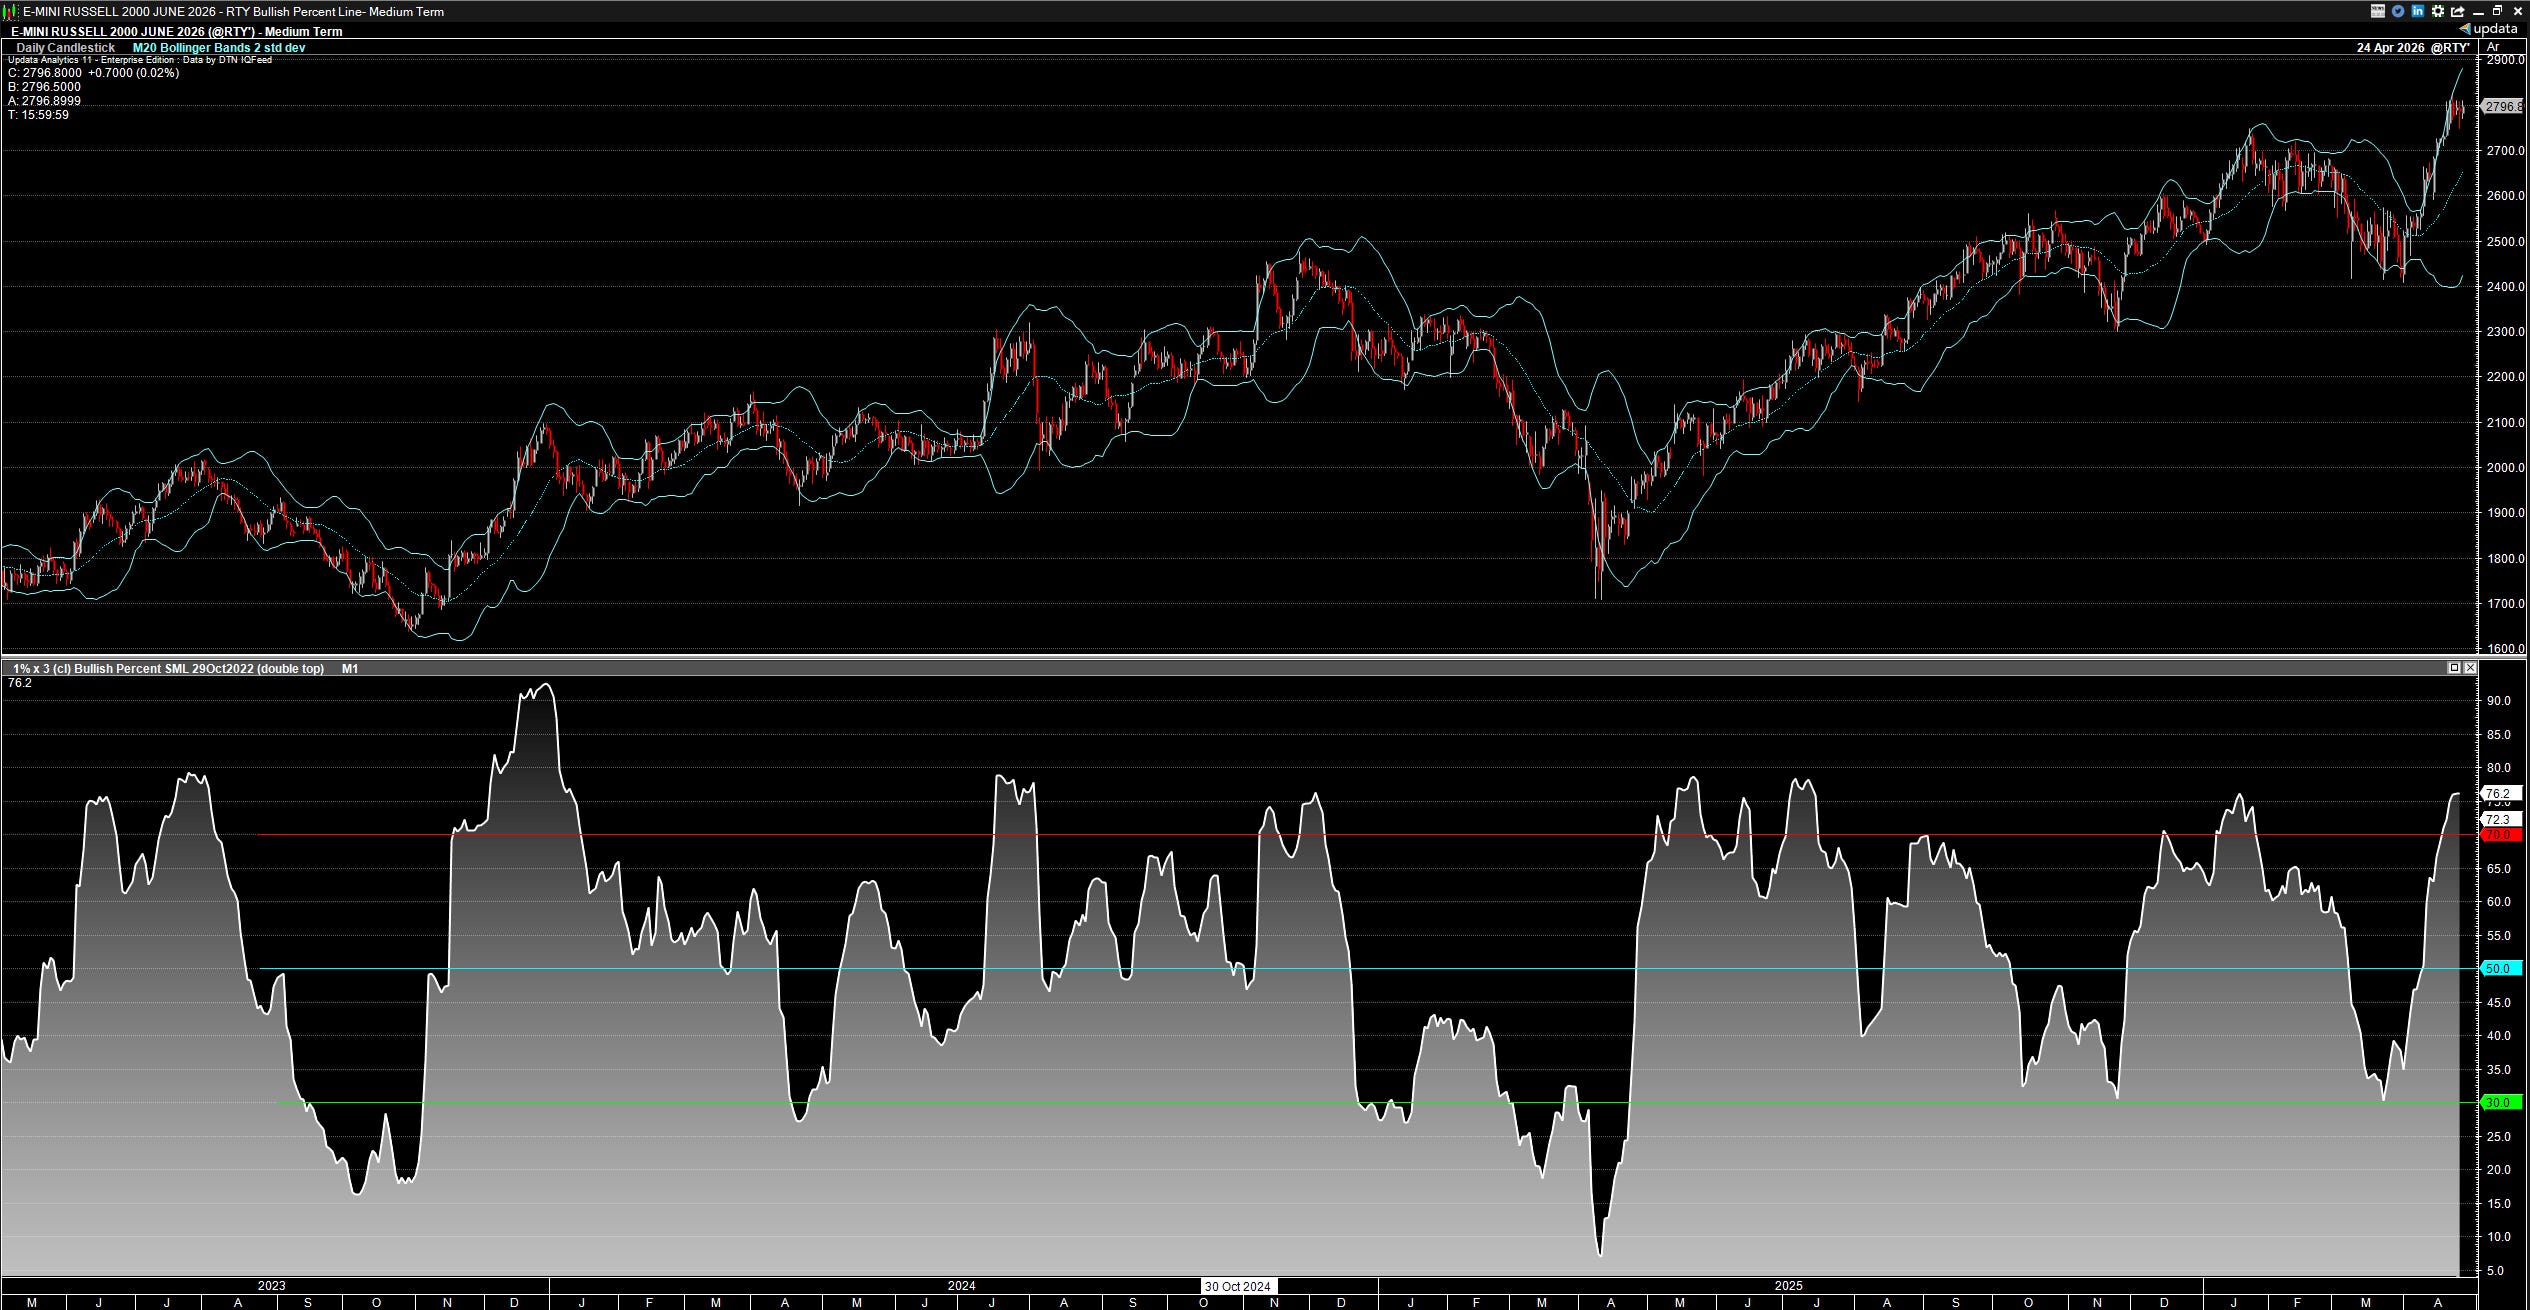
The R2K is most interesting of the 3 indexes. Bullish Percent flirted with a <30 Iran TACO reading, trended higher and is now >70 in the caution zone. I am not shorting here and emphasizing the short-term indicators more, looking harder at index technicals, and divergence.
Russell 2000 Percent Above 150D (30W) Moving Average
Similar to the other indexes no Iran TACO signal and like the Bullish Percent is now >70. This isn’t a time in my humble opinion to ‘rotate into small caps’.
Russell 2000 Percent Above 50D (10W) Moving Average
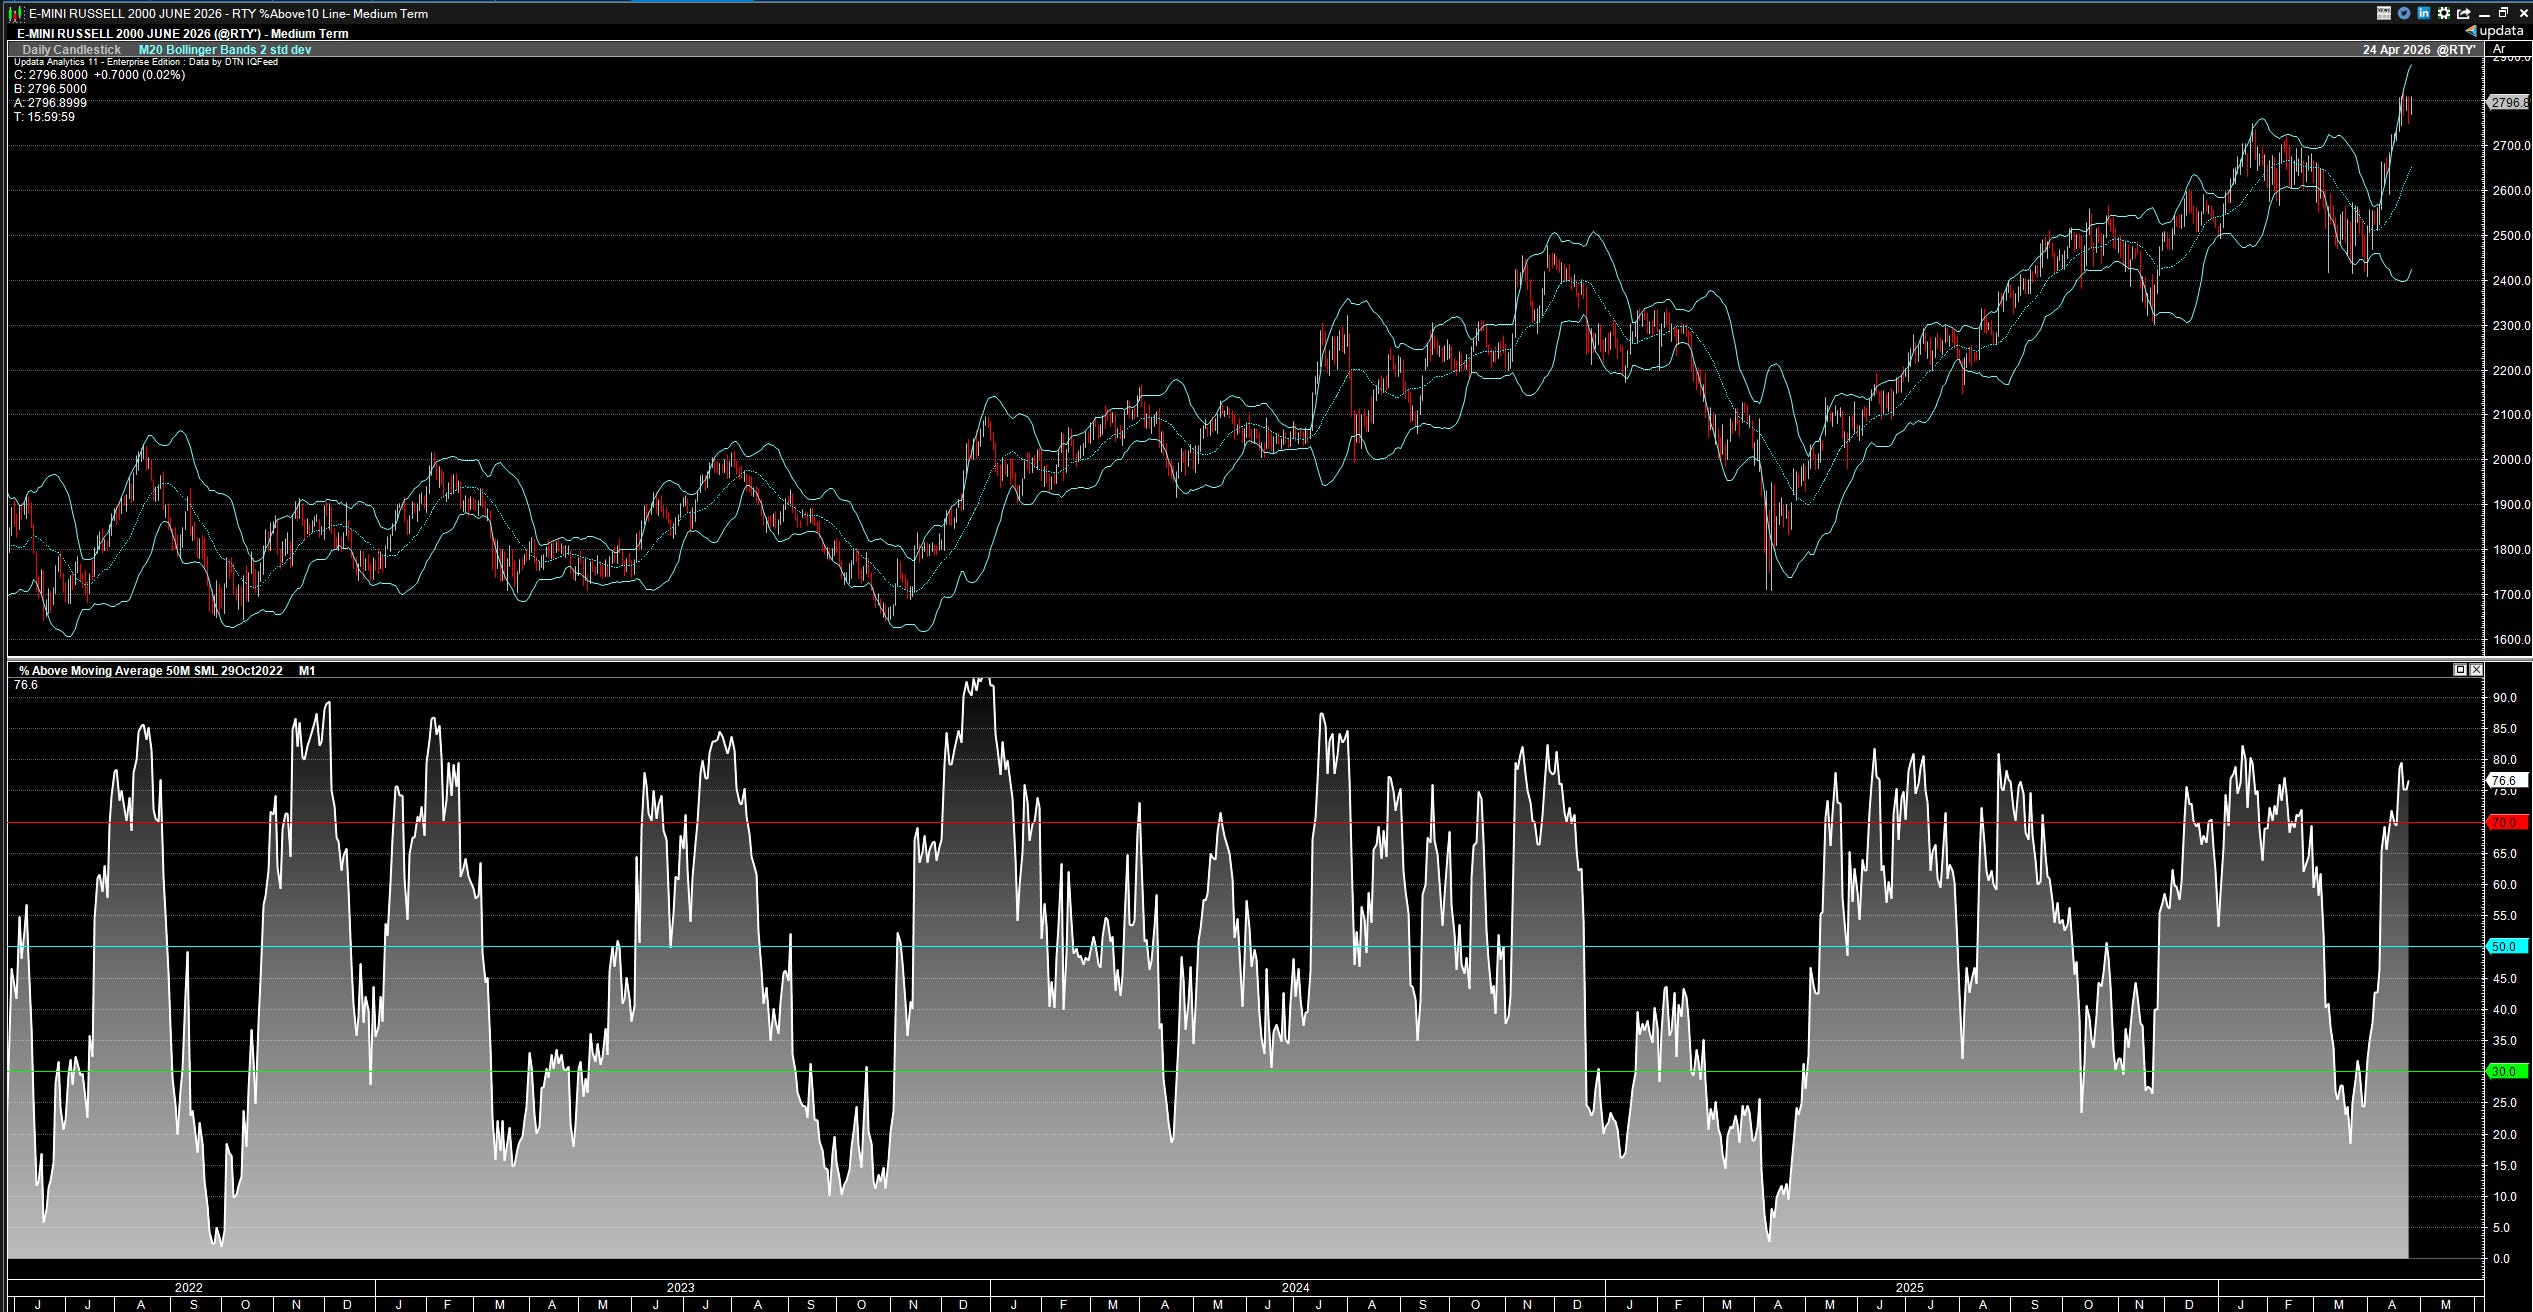
Good Iran TACO signal and now >70. Small caps should definitely be approached with caution from the long side and probably better lightening up some.
Summary
This is some insight into my weekend, when home, market prep for equities. My takeaway this week is the how disjointed is this face ripping rally. Small caps are already in a caution zone and bull markets led by this garbage are suspect. After the face ripping, short murdering, CTA FOMO rally this month it would be reasonable to expect SPX and NDX indicators in the caution zone, but they are not and the indexes still appear to have room to run though every point higher may make longs quicker to sell if/when the world finally recognizes the energy dislocation taking place. Until then, be careful on the short side.
Trade ‘em Straight - Guido
Excellent writeup really appreciate you sharing the process and how you think about this stuff. 🙏
Recently started working with historical data and initial round to crunch data took hours on laptop but then was able to add the new day or week in short order. Are you storing data or pulling fresh every time?